
![]()

Information contained in this news release is current as of the date of the press announcement, but may be subject to change without prior notice.
February 9, 2015
Contributing to organization productivity by increasing the happiness of a group
Tokyo, Japan, February 9, 2015 --- Hitachi High-Technologies Corporation (“Hitachi High-Tech”) announced today that it has developed a new wearable sensor that gathers and analyzes data on human behavior, and uses this data to measure the “organization activation level,” which strongly correlates with work productivity. This product takes advantage of the technology developed by Hitachi, Ltd. (“Hitachi”), which quantifies the “happiness level” of a group from the distinctive patterns of physical movements.
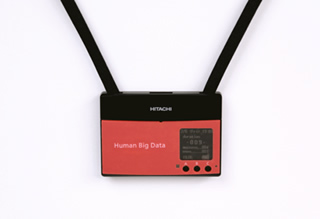
The “new wearable sensor”
Increasing happiness is one of the most important issues for any society. Recently, the Cabinet Office has been studying “Well-being Indicators” for Japan, with a focus on subjective well-being*1, and the Ministry of Education, Culture, Sports, Science and Technology is promoting a research program aimed at achieving a “Happiness Society”*2. Furthermore, in recent research, human happiness is reported to have a significant effect on work productivity*3. Up to now, however, in order to quantify happiness and vitality, it has been necessary to rely on questionnaires based on self-reporting. For this reason, it has been difficult to quantify in real time, and objectively evaluate, the effects that management policies and workplace environments have on the happiness and vitality of employees in a company organization.
The new wearable sensor developed by Hitachi High-Tech can quantify the “organization activation level” by gathering data on human behavior and calculating the activation level of each individual*4. All the individuals' data are then aggregated and averaged out to calculate the organization's figures. The calculated “organization activation level” can support to improve business operations and increase productivity. This was possible with taking advantage of the predictive model developed by Hitachi to quantify the collective happiness of a group from distinctive patterns in physical movements.
The predictive model that quantifies the collective happiness was invented by Hitachi through analyzing huge volumes of human behavior data obtained from wearable sensors, identifying distinctive patterns in physical movements that have strong correlations with a group's happiness, and quantifying as “happiness level”. Furthermore, Hitachi identified that the quantified happiness has a strong correlation with productivity of the organization.
Hitachi High-Tech used these conditions to develop a new wearable sensor which can objectively and efficiently evaluate the effectiveness of management policies and workplace environments in a company, where it had been difficult to achieve such objective evaluations in the past. Users can thus apply the service that makes use of the wearable sensor as a new management support tool.
Hitachi High-Tech will provide this service in a variety of fields as a new solution in the “Human Big Data/Cloud Services”*5 that it is already offering.
Furthermore, Hitachi will use these technologies to support customers in a broad range of business fields in their efforts to improve business performance and support measures to increase happiness of regional residents.
The new wearable sensor developed by Hitachi High-Tech can obtain human behavior data and calculate individual activation level. It obtains distinctive patterns of physical movement of each individual, and after calculating the activation level, “organization activation level” is calculated by aggregating and averaging the results of multiple individuals. The display of new wearable sensor indicates the duration of physical movement and trend of individual activation level, and the wearer can confirm the result in real time.
The day-to-day changes in the “organization activation level” are provided on a cloud service, and they can be viewed on the browsers. Some of the data obtained by the sensors during this period, including the users' physical movements, can be downloaded from the Internet. By reading this data using Excel or a similar application, the users themselves can analyze behaviors with correlation to improvements in their own productivity. The analysis results can then be used in a variety of ways: for example, to improve project management, R&D management, and management in the integration of organizations; to improve productivity in service operations at call centers, logistics centers, and distribution outlets; and to increase customer satisfaction.
Hitachi has been involved in research and development targeting technologies for objectively measuring human behaviors since 2004. Recently, it developed a method for monitoring the status of organizations and finding ways of improving a company's business performance by analyzing huge volumes of human behavior data obtained using wearable sensors (“Business Microscopes”) in the form of name tags, which are equipped with acceleration sensors and face-to-face sensors*6. Recently, Hitachi used these wearable sensors to gather acceleration data that illustrates some 5 billion points of physical movement for 468 employees working in ten organizations in seven companies (a total of 5,000 man-days), and analyzed correlations with data that indicates the group's “happiness level”. Looking at the acceleration data, it focused on duration of physical movements, and investigated correlations with the group's “happiness level”. The group “happiness level” uses data calculated based on the Center for Epidemiologic Studies Depression Scale (CES-D)*7, a self-evaluation scale for depressive tendencies that was developed by the National Institute of Mental Health, and which is used extensively throughout the world. By tabulating data for individual groups (organizations) and examining the relationships with frequency distributions for the duration of physical movements in those groups, it became clear that in groups with a high level of happiness, the frequency distribution for maintenance time was illustrated by a gentle curve with a long, extended “skirt” (much like the shape of Mt. Fuji), while in the case of groups with a low level of happiness, the line was much straighter, dropping sharply like a cliff.
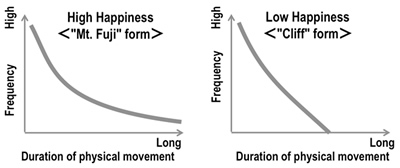
Collective “happiness level,” and time during which physical movements were maintained
Hitachi devised a model for predicting the group's “happiness level” as calculated from the CES-D based on the group's acceleration data obtained from the wearable sensors, and using the two physical movement patterns (“Mt. Fuji” and the “Cliff”), which illustrate the level of happiness. When this approach was applied to actual data, Hitachi confirmed that it was possible to predict the collective level of happiness with a high degree of accuracy, based on the group's behavior data as obtained from wearable sensors*8.
Hitachi discovered a strong correlation between the collective “happiness level”, as measured by the wearable sensor, and work productivity. A total of 215 employees working at two call centers wore wearable sensors for 29 days (total: 6,235 man-days; approximately 6 billion data points measured), and by looking at each call center and each day, it was found that when the collective “happiness level” was higher than the average, the daily order receipt rate was 34% higher than in cases where the “happiness level” was lower than the average.*9 Furthermore, it was found that in the case of four R&D projects (four fields; 85 members; Total: 17,000 man-days; approximately 17 billion data points measured), the collective “happiness level” for the first two months of the projects predicted sales in business based on that research five years in the future (correlation coefficient: 0.99). This suggests that in addition to indicating the group's productivity, the level of collective happiness can also be an effective tool in organizational operations.
An article on this technology is scheduled to be included in the March Edition of the Harvard Business Review (Japanese Edition; Diamond, Inc.), to be published on February 10, 2015.