
NAKATSUCHI Hiroki
Researcher
Resin impregnation molding is a process in which porous structures such as carbon fibers or powdered minerals are impregnated with resins which then solidify. Materials produced in this way are strong yet lightweight, and are therefore widely used in vehicle bodies, aircraft and rocket fuselages, among other applications.
The resin impregnation process differs depending on a variety of conditions including temperature, resin viscosity and length of time. For this reason, determining the conditions under which materials can be completely resin-impregnated is no easy task.
To address this issue, Hitachi has developed a technology to simulate the resin impregnation process.
(Publication: February 2, 2015)
NAKATSUCHIResin impregnation molding is a method of shaping objects using resins. In this method, porous structures are impregnated with resins, which are then hardened. The term resin molding may call to mind an image of pouring resin into a mold, but in resin impregnation molding, resin is inserted into the gaps within carbon fiber or a composite material made of glass fiber and a layered mineral called mica, and then is hardened.
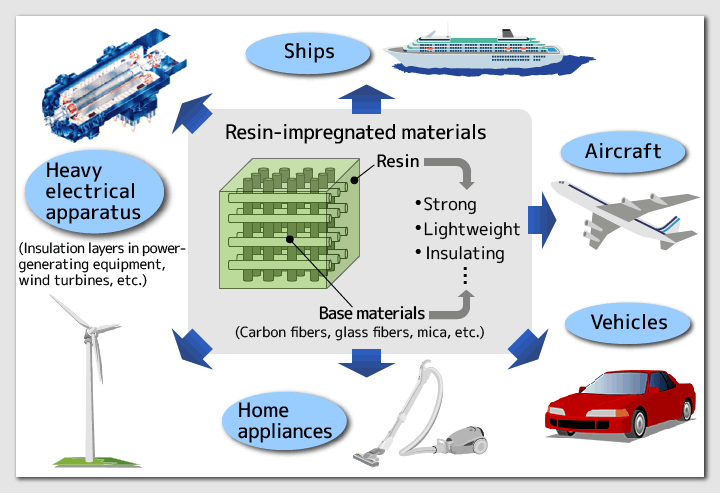
Materials formed in this way can be stronger, lighter or less electrically conductive depending on the types of the base materials used. For example, metals are strong but also heavy. Materials made purely of resin are light but not strong enough. By impregnating base materials with resins, strong and light materials that have the strength of metal but are about a quarter of the weight of iron can be produced. That's why such products are often used in vehicles, aircrafts and rockets, ships and power-generating equipment, to name but a few.
What is difficult with resin impregnation molding is that the flow speed of resins varies depending on how coarse the base materials are and how they are structured. The stickiness (viscosity) of resins also varies depending on the impregnation time and temperature. Lower viscosity allows resins to permeate more easily, and higher viscosity makes it harder for resins to permeate the structure. The viscosity can be lowered by increasing the resin temperature, but then the resin hardens quickly. On the other hand, adequate hardening time can be guaranteed by decreasing the resin temperature, but that increases the viscosity. Therefore, it is necessary to investigate the forming conditions such as the temperature, resin viscosity and impregnation time in order to prevent resins from solidifying before spreading all over the structure.
Figure 1: Application categories of resin-impregnated materials

NAKATSUCHIThe optimum time and temperature for evenly filling with resin differ according to the types and forms of the base materials. Until now we had to make trial pieces under a variety of conditions to find the optimum balance of the temperature, time, resin viscosity and other factors in order to achieve the shortest impregnation time. Moreover, based on our experience, we would forecast the impregnation time from the size and form of the structures in which base materials were placed, then extend the impregnation time longer than the forecast in order to avoid inadequate resin permeation. This meant that the larger the structures became, the longer the time required for production, leading to higher costs.
In order to find out the optimal conditions for impregnation, we need to understand exactly how materials are impregnated with resin. However, it's difficult to actually observe the process. So we thought that, if we could see it in advance through simulations, we would be able to easily learn what time, pressure and temperature we needed to set.
NAKATSUCHITo conduct simulations, you need an analysis model that reflects the characteristics of resins and base materials.
For accurate analysis, you can analyze the shape of the gaps in the base materials on a minuscule level. However, while the size of these gaps is on a microlevel, the size of the base materials is on a "meter" level. It's impossible to fully model based on a microlevel.
So instead of conducting microlevel analysis, we looked at how much pressure is lost when the resin is poured into the base materials, depending on conditions such as the viscosity and density of the resins and the shape of the base materials. An analysis model for calculating resin pressure drop was already available, and we made further improvements on it to create a new analysis model.
NAKATSUCHIThe conventional analysis model had coefficients to represent the degree of difficulty with the resin flow. We have further subdivided them into coefficients regarding the shape and coefficients for the resin viscosity.
We have two types of coefficients regarding the shape. One is the coefficient to represent the difference of the resin flow due to the directions of the base materials and is called the section modulus. The conventional analysis model took into account only a single direction for the resin flow. In contrast, we have incorporated into the formula the differences of the resin flow due to horizontal, longitudinal and depthwise directions. For example, the insulating layers of the stator coils in the power generation equipment, which we used in our latest research, are tapes made of high-density mica chips. As the tapes are wound around the conductors of the coils, the resin is characteristically less prone to flow in the depthwise direction through the thicker parts of the piling tapes.
Figure 2: Analysis model of insulating layers
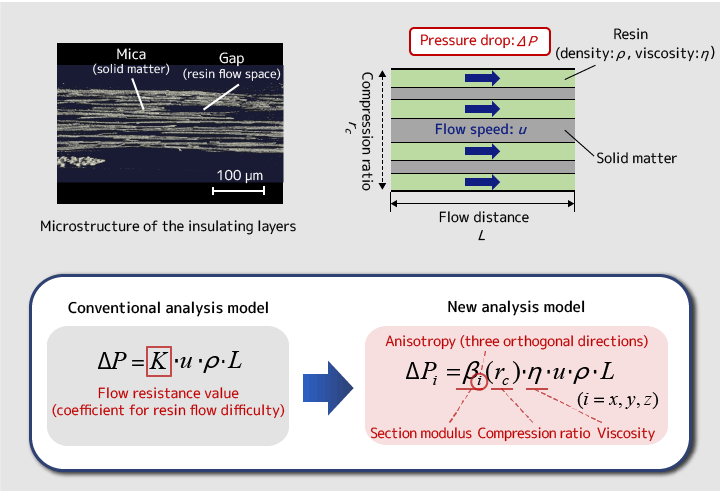
Another coefficient is the compression ratio of the base materials. The cross section of the insulating layers of the stator coils in the power generation equipment is square. When the insulating layer tapes are wound around the conductors, the tapes have higher tension at the corners and are compressed depthwise. When that occurs, the gaps or crevices are broken and the resin struggles to pass. As such, we have taken into account the difference in the compression ratio at different locations.
The new analysis model calculates the pressure drop of resins by determining the section modulus, compression ratio of base materials and resin viscosity. The compression ratio of base materials and resin viscosity can be determined by using different formulas. However, the section modulus must be measured by conducting resin flow experiments using samples of base materials.
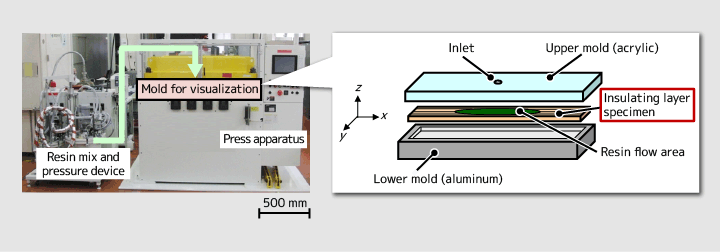
NAKATSUCHITo determine the section modulus, it is necessary to experiment to measure how differently resins flow in the horizontal, longitudinal and depthwise directions in the base materials. However, it is difficult to see how resins flow in the insulating layers. Instead, we placed plate-shaped samples that had insulating layer tapes overlapped and accumulated. We poured resin into the samples from above and observed how it spread.
As for the composition of the apparatus, an aluminum lower mold is placed at the bottom, and the insulating layer samples are set on it. Then, a transparent, acrylic upper mold with a hole (an inlet) is placed onto it. After affixing the lower and upper molds by using a press apparatus, resin is injected through the inlet of the upper mold. Based on the state of the spreading resin (information such as flow area and flow distance), we determine the section modulus for the analysis model mentioned before.
In the case of the insulating layer samples, resin tends to flow easily in the horizontal direction through the crevices between the tapes but less so in the depthwise direction within the high-density tapes. In accordance with these characteristics, the lower mold in which the samples are placed has been made longer in the horizontal direction and narrower in the depthwise direction. When resins are actually injected, they spread in a long and narrow elliptical shape as they tend to flow more easily in the horizontal direction.
Figure 3: Experimental apparatus to determine the section modulus

NAKATSUCHIThe insulating layers had an extremely high-density structure, and the speed at which the resin flowed was totally different depending on the direction. This made our first approach a tough one.
It would have been easier if resin flowed in the same manner. However, it tended to flow less easily in the depthwise direction and more easily in the horizontal direction. If the resin reached the end horizontally before it did in the depthwise direction because of this characteristic, the experiment was a failure.
When we decided on the size of the insulating layers used in the experiment, we repeatedly made trial pieces at the plant. At the designing stage before preparing the experiment apparatus, we had to collect information through trial and error, which was difficult.
NAKATSUCHIThe analysis model mentioned earlier is incorporated into the three-dimensional fluid analysis software, and impregnation conditions such as the shape of the base materials and the density, pressure, time and temperature of the resin are inputted. Then it is possible to see how the resin fills and how the pressure changes.
The stator coils in the power generation equipment used in the experiment have a three-dimensional shape, with the both ends curved. They are dipped in resin in a tank. In our simulation, however, the curved shape is not reproduced as is; rather the length when they are straightened is reproduced. That is what is shown in the analysis results in Figure 4. The curved line at the top shows the actual shape of the coil. The simulation results are indicated below it. The simulation then does calculations as to how much time is required for the resin to complete filling. Depending on conditions such as the temperature and pressure, the simulation can also predict that resin impregnation cannot be completed.
Figure 4: Illustrated figures of the simulation using three-dimensional fluid analysis software
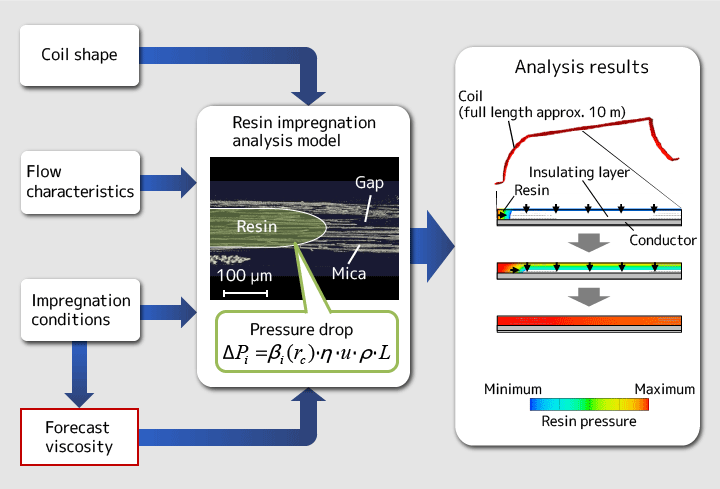
Figure 5: Resin permeation ratio comparison
(analysis results and measured values)
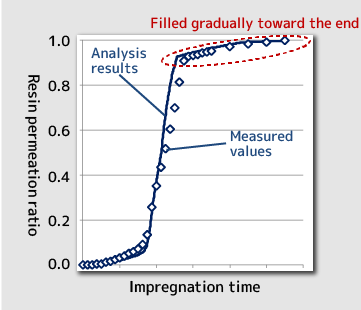
NAKATSUCHIThe analysis results tended to match the measured values. Figure 5 shows a comparison of the simulated and measured values of the filling ratio of the resin. The solid line represents the analysis results, and the diamond marks indicate the measured values.
At first, the resin permeates gradually. Then the filling speed increases. The resin begins to harden toward the end and the filling speed decreases. The simulations successfully reproduced this bit-by-bit resin permeation behavior.
When actually measuring the values, we have to be present around the clock for a few days, although rotating the staff occasionally. So we were overjoyed when we learned that the simulation results matched the measured values fairly well.

NAKATSUCHIWe would like to expand application of the simulation technology for resin impregnation molding into a variety of fields. We started our research using the insulating layers of the stator coils in the power generation equipment as base materials, which were rather difficult to analyze. So I think we would be able to apply the technology to other base materials to a certain degree. Magnetic resonance imaging (MRI) equipment, for example, also uses coils for which resin impregnation is conducted. I have long had a wish to get involved with a variety of products through research, and I'm glad I did so through this development.
We also want to further advance the analysis technologies for simulation. This research has analyzed how resins flow from the macroscopic and physical perspectives in terms of how resins spread. Next, we hope to make more microscopic analysis. At present, we need to conduct experiments to determine the coefficients whenever we change the base materials. If we can determine the coefficients more simply, we should be able to perform simulation more easily. For example, it would be ideal if we can determine the coefficients for the analysis model by simply taking photos of the base material structures. To do so, it would be necessary to enhance the accuracy of computed tomography (CT) scanners to take cross-section images of base materials.
NAKATSUCHIDepending on the conditions, resins change from liquid to solid state. This is what I find interesting as well as difficult to handle. How resins flow is subject to not only physical conditions but also chemical reactions. So we must investigate and clarify the relationship between physical and chemical phenomena. Furthermore, aside from the production process, it is important to evaluate long-term reliability as to how resins change state after being produced depending on the environment in which they are used. I believe this is a task that future simulation technology must be able to perform.
There are many aspects about resins that we do not understand yet, so we must also learn more about resins themselves.
