21 January 2021

Ramesh Rakesh
R&D Centre, Hitachi India Pvt. Ltd.
The risk of cyber-attack in a network infrastructure is often determined by scanning the devices in the network to detect existing vulnerabilities. The risk is then mitigated by patching the vulnerable software with the latest security patches. Since software patching is associated with device downtime, this process is generally conducted outside of business hours so as not to impact daily business operations. This limited time window to install security patches on the devices is a challenge for security administrators and may result in unpatched vulnerabilities in the network which raise serious security concerns. To reduce security risks, network administrations use different techniques to identify the devices that need to be prioritized patching.
Attack path analysis technique is one such technique that is often used to predict the path from the external facing entities to the inner hosts in a network to prioritise device for patching. For this technique to be effectively applied, it is necessary however, to convince the security administrators and Chief Information Security Officers (CISOs) to allow the ad-hoc down time required for patching the systems (against scheduled downtime). A consolidated risk value per device based on vulnerabilities discovered on a daily basis could provide an objective basis for CISO to allow such downtime as opposed to deferring it until a later date during a scheduled shutdown.
Many tools have been developed to support decision-making concerns related to network security.[1-4] These tools are based on attack graphs which take vulnerability databases and network descriptions as input and produce security assessments as an output. In the attack graph model, a state-based modelling of various states of the nodes before and after an attack are represented, and a system level attack scenario is generated. These approaches, however, do not consider the topology of a network to assess risk of nodes. We therefore considered risk assessment for each device given the topology of the network, and the vulnerabilities present in the nodes. Since vulnerability scanning does not directly reflect the complex attack routes existing in the network, a Bayesian network-based approach has been applied by Hitachi to model network topology for calculating risk of hosts in Security Risk Management System (SRMS).[5, 6] The Bayesian network-based approach was, however, observed to be too generic. Due to computational complexities involved with deep network having higher number of devices, this technology is limited to scale.
To overcome the challenge, the concept of Exploit Path Graph was used. The Exploit Path Graphs only consider the possibility of a node on an exploit path being compromised by at least one of its vulnerabilities and compute the probability of compromising a device/node at the end of an exploit path which starts from a network ingress node. In this approach, all the constraints and assumptions used in SRMS is retained. Note that we distinguish between a device being “exploited” vs. “compromised”. As explained in Figure 1, if a device has vulnerabilities, and an attacker has access to the vulnerabilities either by getting physical access to the device or through remote connection to the device, it may use “exploits” in the form of malware or other payloads – but the device may or may not be compromised by that. If the device has no security mechanism in place (e.g. anti-malware, or input sanitation etc), it may be taken over by such an attack, and we can say that the device has been “compromised”. Otherwise, the exploit may have been delivered but the device may function without being taken over or compromised. The structure of such graphs also allows us to enhance the scalability of our method, by using a layered approach. The layered approach involves application of probabilistic model checking on a series of models extracted from the Exploit Path Graphs.
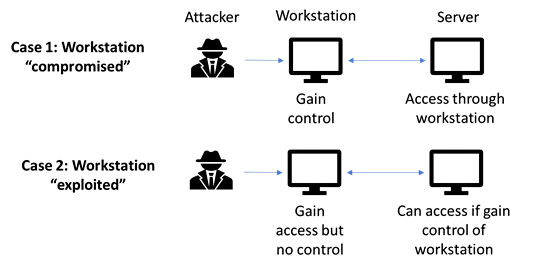
Figure 1: "Exploited" vs "compromised"
Considering example network topology in Figure 2, a single stage network where the attacker entry point is the firewall. All the Exploit Path Graphs are represented as a graph where there are two kinds of nodes. The devices are represented by a computer host icon, and a box indicating their labels. The open lock symbols depict nodes representing vulnerabilities. The vulnerabilities are grouped together based on their levels of criticality - in this case, two groups of high and low criticalities. If there are more levels - these groups are color-coded in the figures. In this example, the firewall in the left-hand side graph of the Figure 2, has 143 vulnerabilities. Of these, 44 of them have high criticality scores, and other 99 have lower scores. That is the reason why the graph has integral numbers on the lock symbols representing the number of vulnerabilities with the same criticality. Since the quantitative aspect of exploitability is dependent on the scores, and not the exact nature of the vulnerabilities, the exact nature of the vulnerabilities has been abstracted out in these graphs. Note that even if one out of 143 vulnerabilities gets exploited, there is an 80% chance that the firewall will be used as a pivot to launch further exploits to the nodes connected to the firewall. Looking at the exact probabilities (vulnerability scores) – we find there are 6 distinct groups, if we group all the vulnerabilities with the exact same score in the same group, the value of probability comes very close to 1 (ranging between 0.96 to 0.34).
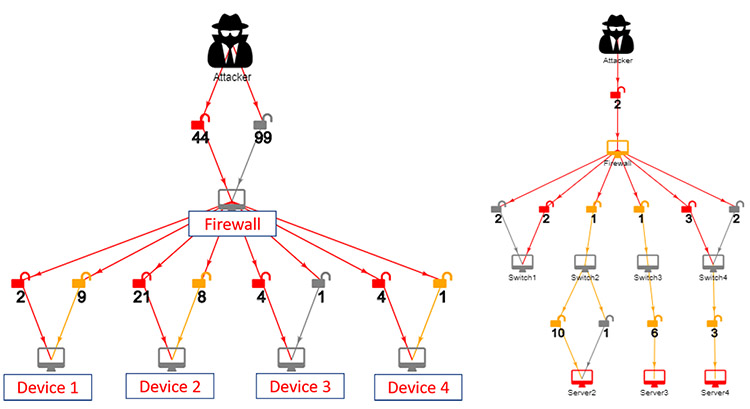
Figure 2: Sample Exploit Path Graph 1 and 2
This is natural because if a firewall has 143 vulnerabilities some of which very high probability of being exploited, it is as good as certain that the firewall will be compromised. This logic is used stage wise to construct the probabilistic action model required by the PRISM model checker.[7] We also considered real-time situations where any device can be attacked directly without any prerequisites. For example, as per first approach, firewall needs to be compromised to gain access to Device 1 (to attack Device 1 in Figure 1,). But, in real conditions, there may be cases that the attacker has direct access to Device 1. So, in this case, firewall need not to be compromised.
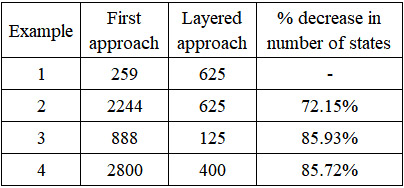
However, this approach had some scalability concern. To mitigate this, a layered approach was considered. This approach is based on dividing the Exploit Path Graphs into different layers. In the example network in Figure 1, the firewall is considered as first layer and the devices 1-4 is considered as another layer. Hence, two layers are created. Similarly, Example 2 will have three layers. From Layer 1, the probability that the firewall gets exploited is fitted into Layer 2, as input to the devices along with its conditional probability. The probability that “firewall” gets exploited comes out to be 1, it is multiplied with the conditional probability (0.8 as constrained in SRMS) of each of the four devices. Hence, the probability of the firewall getting exploited is 0.8*1 = 0.8 and the probability that Device 1 is exploited is 0.8. Hence the conditional probability of device being exploited is 0.64 (0.8*0.8). This is how conditional probability for other devices was calculated. This results in two PRISM files for two layers, which will reduce the number of states and improve the scalability of the system. A comparison in the table 1 shows superiority of layered approach in terms of scalability due to decreased number of states.
Table 1: Number of states in both the approaches
The presented approach has some limitations which needs to be addressed in the future work. Risk scoring mechanism does not consider the expertise level of attackers. A very capable attacker, or an attacker buying exploits for vulnerabilities known through NVD (National Vulnerability database), from the dark web, the real risk is much higher than these scores reflect. Hence, human study is needed to know how cyber teams in an enterprise would use these scores and see whether they have positive or negative effects. Direct attacks on devices are modelled, assuming either an insider attacker with direct access to a device or a legitimate connection to an inside device due to a firewall misconfiguration, wrong ports being opened, or a web service/FTP service etc. running on the device. For more detail of the technology and its benefits, please refer to the published paper, "Cyber Risk Assessment of Networked Cyber Assets using Probabilistic Model Checking" [8] which was selected for a best paper award at IEEE CICT 2019.[9]
*If you would like to find out more about activities at Hitachi India Research & Development, please visit our website.
