Hitachi has developed an influenza forecasting service that uses AI (machine learning) to produce four-weeks-ahead forecasts of the number of influenza sufferers in each region of Japan and publishes the results as an index indicating the degree of prevalence (level 0 to 3). A demonstration project that commenced in December 6, 2019 provides the influenza prevalence forecasts to residents of Saitama City in Saitama Prefecture. This is the first time that infectious disease forecasting has been trialed in Japan on the scale of a municipality. The project was undertaken in partnership with Sompo Japan Insurance Inc. and with the approval and assistance of government and numerous corporate and non-corporate organizations. A variety of service requirements have come to light in the process of arranging and running the project. Hitachi plans to continue evaluating the service while also assessing its business viability.


Seasonal influenza spreads through the population every year during the dry months of winter. The cumulative total of people receiving treatment for influenza at medical institutions in Japan during the 2018/19 season (from week 36 of 2018 to week 17 of 2019) was approximately 12 million(1). This represents a major cost to society, with the economic impact of influenza having been estimated at around JPY660 billion(2). For parents of small children, infectious disease is on average the cause of infants in the first year of life missing approximately 24 days a year of daycare(3), meaning that infectious diseases that threaten the health of the most precious infants is also a major obstacle to employment. Influenza in particular causes people to be off work for extended periods and is one of the infectious diseases affecting children that causes the most concern to parents.
As parents themselves, the authors have experienced this concern. The idea of creating a new service to raise awareness of preventive measures was inspired by a desire to create a world in which nobody, especially children, needs to suffer from infectious disease. It was this that led to the development of the influenza forecasting service for predicting the prevalence of influenza in each community and making the information available as a forecast.
Fig. 1—Diagram of How Information is Distributed
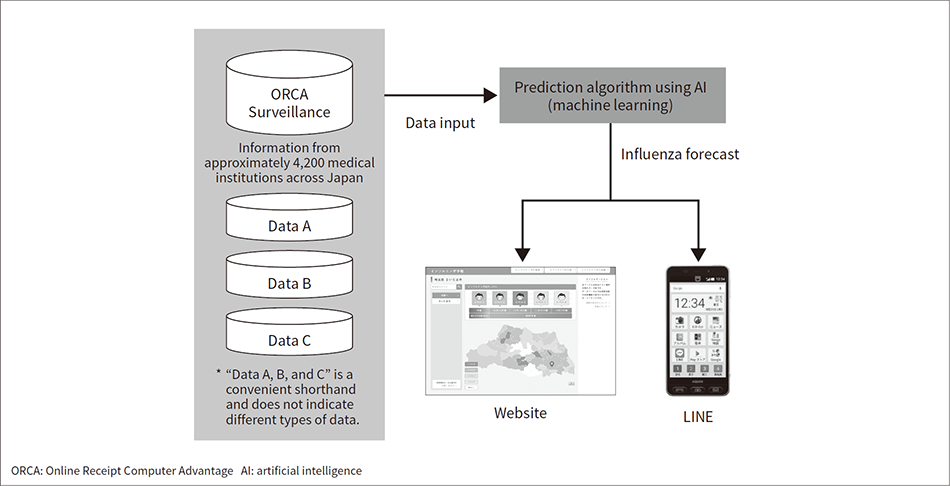 The service uses AI analysis to produce four-weeks-ahead forecasts of the number of influenza sufferers in each region of Japan, with the results being published as an index indicating the degree of prevalence (level 0 to 3). The ORCA Surveillance dataset is the main source of training data used for this AI analysis.
Fig. 2—Website Screenshot
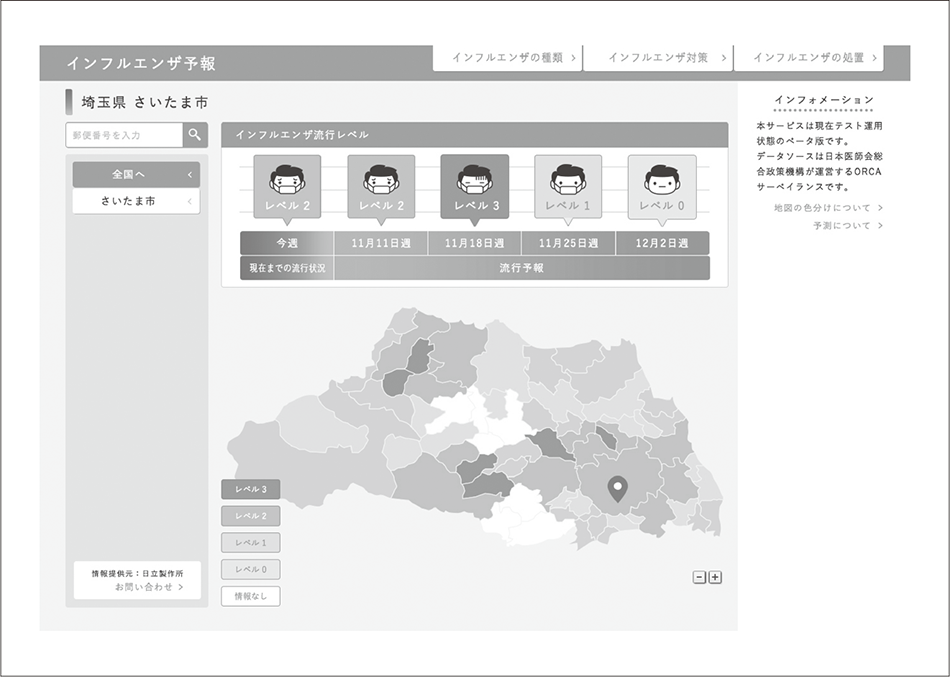 The map is color-coded to indicate the current degree of prevalence in each community. Clicking a particular community displays face icons that represent the forecast prevalence for that community over the coming four weeks. In this example, Saitama City is selected.
The service uses artificial intelligence (AI) machine learning to produce four-weeks-ahead forecasts of the number of influenza sufferers in each region of Japan and publishes the results as an index indicating the degree of prevalence (level 0 to 3). Figure 1 shows how the information is distributed. The service combines data from a multitude of sources, most notably the Online Receipt Computer Advantage (ORCA) Surveillance dataset collected by district or municipality that is based on the number of people suffering from infectious diseases (including influenza) reported to ORCA Management Organization Co., Ltd. by more than 4,000 participating medical institutions across Japan. It achieves precise forecasting by using AI to analyze this data from medical institutions. The predictions are published on a website where it is available to be viewed from a PC, smartphone, tablet, or other device. The service also has its own account on the LINE*1 communications app that can deliver regular forecasts to anyone who subscribes.
Figure 2 shows a screenshot of the website. The displayed page includes a map, face icons (indicating the degree of prevalence), and an information panel. The map is color-coded to indicate the current degree of prevalence in each community (averages from the past seven days). Similarly, clicking a particular community (municipality) displays the forecasted prevalence for that community over the coming four weeks in the form of face icons. The information panel contains additional details about the predictions, including definitions of the degrees of prevalence. These are as follows.
Level 3: Rate of new cases equal to or greater than the peak of the previous year (FY2018), which was between January 21 and 27, 2019
Level 2: Rate of new cases greater than or equal to half that of level 3
Level 1: Rate of new cases less than half that of level 3
Level 0: No new cases
That is, to provide an intuitive indication of the degree of prevalence that will make sense to the general public, the level thresholds are based on the peak period for cases during the previous influenza season.
By using the service, people can take precautions based on the influenza forecast for their community in much the same way that weather forecasts help them plan daily activities by suggesting when to avoid outings and when to take an umbrella. As well as preventive actions such as handwashing or use of mouthwash, it is anticipated that the service will also assist people in their daily lives, such as by helping them to prepare for the possibility of falling ill. In the case of households with children, this might involve coordinating work, adjusting leisure plans, or making arrangements with school.
A demonstration project to trial the influenza forecasting service in Saitama City was conducted from December 6, 2019 to March 20, 2020 in partnership with Sompo Japan Insurance Inc.
As part of its assessment of the business viability of the influenza forecasting service, Hitachi gave a presentation on the service to Sompo Japan Insurance in February 2019. This led to the two companies embarking on a joint plan based on a shared vision of wanting to reduce the number of people suffering from infectious diseases while also doing what they can to eliminate obstacles to women entering the workforce. The companies began by consulting with a number of private-sector companies and other organizations with the aim of clarifying the service requirements and associated issues. This consultation indicated that there was a high level of support for the concept of an influenza forecasting service but also identified certain issues as warranting investigation prior to a full-scale launch, including feedback that questioned whether the forecasts would really raise awareness of prevention among the public and, if so, lead to genuine behavioral changes (measures to prevent infection), and whether information about the prevalence of infectious disease might in fact encourage harmful misinformation.
After considering how to investigate these issues, it was concluded the best way to do so would be to operate the influenza forecasting service in a limited geographical area and obtain direct feedback from the residents of the target community, an approach that would also indicate the effectiveness of the service.
As to the question of where to run the trial, the choice was made to proceed in Saitama, a city of 1.3 million people and one of the major urban areas in the Kanto region. The reasons for the choice included the city having a partnership agreement with Sompo Japan Insurance and also the work it is undertaking on its Smart City Saitama Model, a collaboration involving residents and academia that draws on skills and expertise in advanced technologies such as AI and the Internet of Things (IoT). Concerns raised by the city when the project was first proposed included that influenza forecasts might foster anxiety in the community and that, because the Saitama City Institute of Health Science and Research was already publishing weekly influenza reports, the excess of information might cause public confusion. These concerns were addressed by designing the layout and content of the forecasts to be non-threatening and easy to understand. Ultimately, the city came to recognize that the demonstration project would help improve residents’ quality of life (QoL) and so gave its consent for it to proceed.
Following on from the city’s decision, a large number of other corporate and non-corporate organizations also chose to participate in the project (Misono Town Management Association, Inc., Saitama City Pharmaceutical Association, Japan Association of Health care Initiative, AEON Retail Co., Ltd., Welcia Yakkyoku Co., Ltd., SoftBank Corporation, Saraya Co., Ltd., LINE Corporation, and Saitama Railway Corporation).
Fig. 3—Design of Leaflets and Posters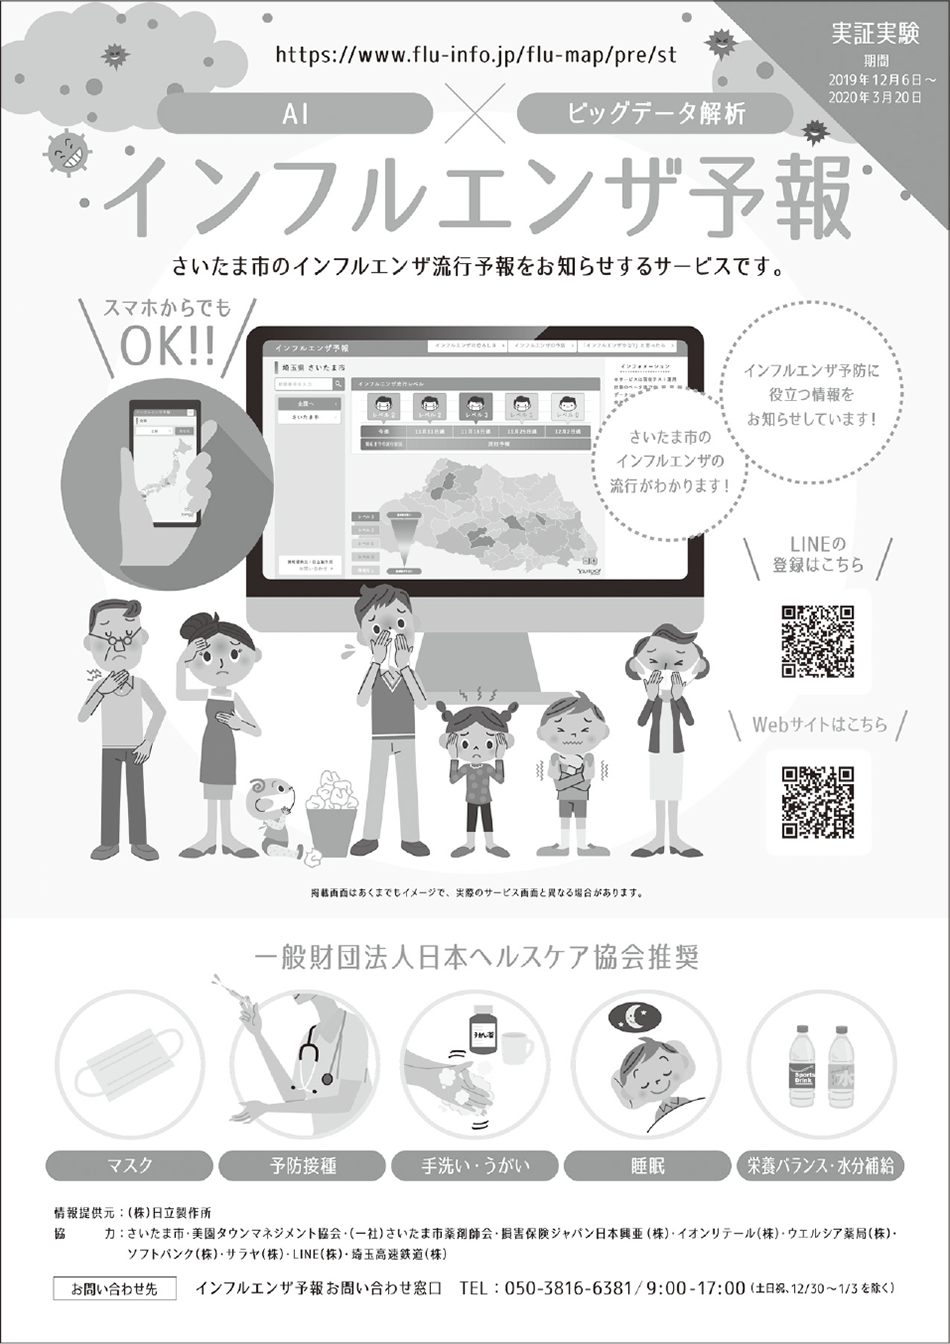 To help residents access the forecasts, the design includes a QR code and uniform resource locator (URL) for the website and a QR code for subscribing to the LINE account. A call center is also available for inquiries.
The Saitama City demonstration project used a variety of means to distribute the forecasts, including a website, the LINE app (with updates released every Friday), and signage located at city retailers. First of all, leaflets were distributed to public elementary schools, junior high schools, childcare centers, and kindergartens. Participating companies and organizations were also asked to put up posters. Figure 3 shows the design of these leaflets and posters. To help residents access the forecasts, these included a QR code*2 and uniform resource locator (URL) for the website and a QR code for subscribing to the LINE account. The project website displayed the current and forecast prevalence of influenza for Saitama City. While the site also contained information about other locations, this was restricted to the current prevalence only.
A sense of the future potential of the influenza forecasting service was gained from the large number of inquiries received from private-sector companies and news media people after Hitachi, Sompo Japan Insurance, and Saitama City put out a joint news release describing the project(4).
The intention is to assess the project, including the effectiveness of the service and its benefits in terms of reduced case numbers, by surveying Saitama City residents and analyzing data on the number of people with influenza in the current (FY2019) season.
The process of arranging and running the demonstration project included consultation with a large number of stakeholders and other such discussions. This revealed the diversity of information needs regarding influenza case numbers. Here, information about influenza sufferers is considered in terms of whether it is historic data or a prediction.
Historic data on how many people suffer from influenza is needed for work on the prediction model (calculation of future case numbers), making this important data for research and development purposes. Assuming it is possible to identify correlations between historic case numbers and point-of-sale (POS) data for particular products, another possibility would be to build demand prediction models.
Data on predicted case numbers has potential use as a “nudge,” a means of prompting behavioral changes in people by providing them with advance risk information. Possibilities include reducing case numbers by people taking preventive action on their own initiative or use in marketing strategies for promoting sales of preventive products. Lower case numbers could be expected to help minimize the ever-expanding burden on national and local government (social security costs).
Along with strengthening collaborative arrangements with the ORCA Management Organization to enable the distribution of information in ways that are even more closely tied to individual communities, Hitachi is also seeking to expand the information infrastructure by establishing ways of collaborating with pharmacies, schools, and companies that hold patient information. Meanwhile, infectious diseases like influenza are a challenge for the entire world, not only Japan. Hitachi recognizes a need for more investigation as it looks to expand the service globally in the future with a view to helping accomplish the Sustainable Development Goals (SDGs).
Dramatic structural changes are taking place in various different fields around the world as a result of digitalization. Digital innovation can be characterized as a value shift from tangible goods to intangibles. The value now attributable to data is a key feature of this transition along with the important questions of (1) How can the productivity of society be enhanced through the use of data, and (2) To what extent can new business models established on the basis of data foster value-creating markets. There is expected to be a diverse range of requirements for information about the prevalence of influenza, and it has become apparent that related data has the potential to generate new value. The service also has the potential to be used to provide information about new infectious diseases such as COVID-19 that pose a threat to all humanity. Accordingly, Hitachi plans to investigate what other features to include with the aim of establishing it as part of the information infrastructure for public safety and security. As a Lumada business, Hitachi also sees the service as contributing to its goal of combining social and economic value.
