Technology Innovation for Accelerating Digital Transformation
The digitization of previously undigitized field conditions using sensors and signal processing can assist in resolving issues in the field. This article describes an inspection automation system that digitizes the visual inspection of field assets as an example of digitizing field conditions using sensors. Hitachi has developed a system that digitizes the display of analog instruments deployed in fields such as factories and collects the data via a wireless network. Wireless image analysis modules that scan instruments can operate for three or more years with only an internal battery. They can be easily installed on existing assets without the need for wiring work. In the future, Hitachi will create service solutions that resolve issues in the field by digitizing the various data that used to be collected visually by humans.


There are many large assets in facilities such as factories, power plants, and large buildings, and even a single failure can have a serious impact on business continuity.
In recent years, the increased frequency and scale of failures caused by aging assets are becoming issues. Although increasing the frequency of inspections can be effective in preventing failures, there is a limit to how many inspections can be performed manually, and the resulting increase in maintenance costs also cannot be ignored. The aging population has also led to shortages in maintenance personnel and it is difficult to increase the human resource budget for asset inspections.
Hitachi is developing an Internet of Things (IoT) service solutions business that assists in resolving issues in the field by digitizing various field conditions using sensors and signal processing.
This article describes an inspection automation system that digitizes the visual inspection of field assets as one example of digitizing field conditions using sensors.
Field assets in facilities such as factories are equipped with many analog instruments such as pressure gauges and oil meters. Instruments require visual inspections at intervals from several weeks to several months, and periodic inspections by maintenance personnel help to prevent failures (see Figure 1).
The analog instruments of these factory field assets are dispersed widely over a large area. For example, even a small-scale facility of approximately 100 m2 may contain 100 analog instruments. This is because a large number of pipes are used in the field and each pipe is equipped with analog instruments. Currently, most of these instruments are checked visually by patrolling maintenance personnel.
To address this, there is a need to reduce maintenance workloads by digitizing and transmitting the displays of analog instruments in order to digitize inspections. Furthermore, because digitization enables various analytical technologies to be applied, new benefits can be expected in terms of increased asset operation efficiency and predictive detection.
Currently, some analog instruments are being replaced with digital instruments that are being monitored remotely. However, because analog instruments are directly connected to parts such as asset pipes, their removal or replacement is often difficult and operation of the asset must be stopped when working on it. Some instruments are installed in locations with difficult work environments such as outdoors or at tall heights, requiring considerable investment to install cables for power supply and data transmission. As a result, the digitization of field assets has advanced only up to a certain point.
Figure 1—Visual Inspections by Field Personnel
 Because most instruments are analog, visual inspections are performed by maintenance personnel.
To resolve these issues, Hitachi is developing an inspection automation system that digitizes the visual inspections of field assets. Figure 2 shows an overview of the inspection automation system. In this system, a wireless image analysis module is attached to each analog instrument in the field. These wireless image analysis modules use camera imaging and image analysis to digitize the analog instrument displays and to transmit the digitized data via wireless communication. The transmitted digital data is collected by a manager device via wireless communication. The manager device relays the collected digital data to a server or the cloud, and adjusts various settings and manages the status of the wireless image analysis modules.
This inspection automation system has the following three features. These features enable the system to be installed without stopping existing assets, making it possible to collect the data corresponding to visual inspections remotely.
To achieve these features, Hitachi developed technologies that reduce the volume of transmitted data using image analysis, reduce the power consumption of the wireless modules using power supply control, and provide wireless communication using a mesh network. The following describes an overview of these technologies.
Figure 2—Overview of Inspection Automation System
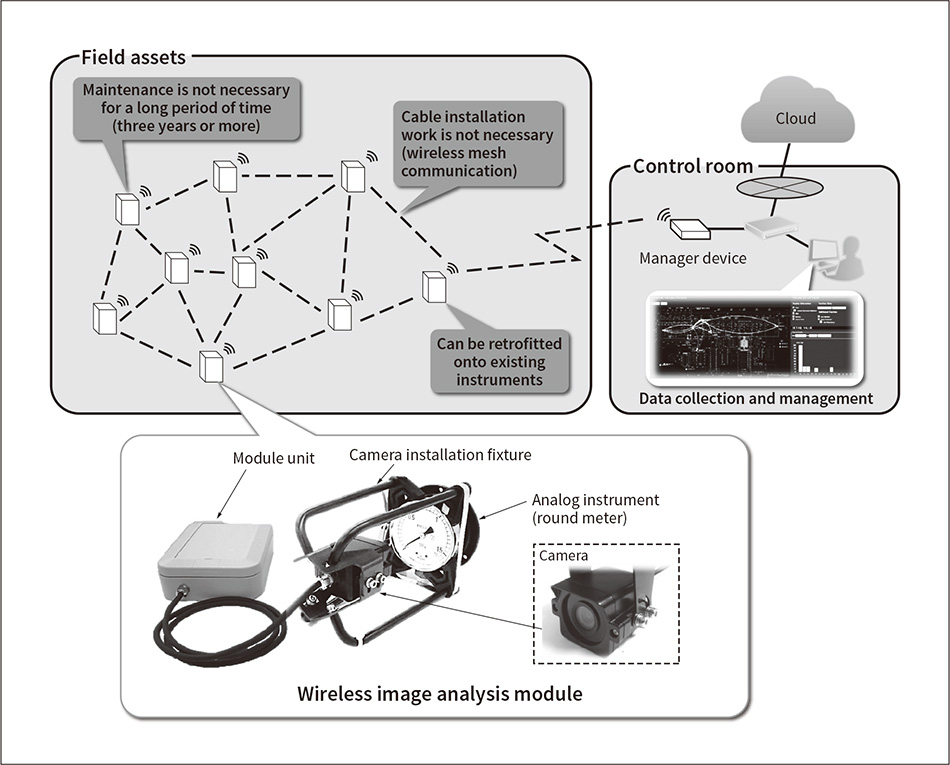 Wireless modules installed on field assets read the values measured by an instrument and transmit the data via wireless communication. The measured values are saved together on the manager device and utilized on a server or the cloud.
To digitize visual inspections without replacing existing analog instruments, Hitachi developed a system that obtains images of the analog instruments by using cameras and then obtains readings from those images.
When wiring work such as power supply is possible, the image data collection system can be easily installed using the existing webcams and the like. However, because work such as cable installation is often difficult in the field, such as a factory, the locations where this method can be applied are limited. To resolve this limitation, the wireless modules need to be capable of operating independently for a long period of time on battery power. In other words, the power consumption of the wireless modules must be reduced.
The biggest limiting factor in reducing the power consumption of the wireless modules is wireless communication. The communication speed and the amount of data that can be sent in one communication are both dependent on power consumption, which means they are severely limited. Because image data, in particular, increases the data volume, it is important to reduce the volume of transmitted data. Various image compression technologies are available as means of reducing the volume of image data and these technologies are widely used. However, when the conditions for communication speed and data volume are severely limited, as in this example, it is difficult to achieve sufficient reduction using existing image compression technologies.
To address this, Hitachi devised a method that analyzes the camera images inside the wireless modules and converts them into semantic information. For example, when a round mechanical meter is read by a camera, the angle of the meter's needle and the minimum and maximum values are detected using image analysis, and the instrument reading is digitized based on that angle. This enables the volume of transmitted data to be reduced from approximately 120 kilobytes to four bytes, as compared with transmitting the raw image data. This reduces the data to 1/30,000 of the original volume (see Figure 3).
To enable this image analysis to be performed within a wireless module, processing must be performed by a microcontroller unit (MCU) that can be built into the wireless module and powered by a battery. This means it must be implemented with an extremely low level of computational resources. Moreover, the target meter types come in a vast number of shapes and sizes. In this system, the parameter calculations that require heavy processing are performed only for the first reading after installing the wireless image analysis module, and the results are saved. This not only reduces the power consumption required for image analysis, but also enables the flexible handling of a wide variety of analog instruments.
In addition to reading round mechanical meters, this method can be applied to a diverse range of other instruments. For example, by using image analysis to detect the color of a moisture-absorbing respirator (silica gel), and digitizing the discoloration ratio of the respirator, the level of respirator wear can be identified.
Figure 3—Reducing the Volume of Transmitted Data Using Image Analysis
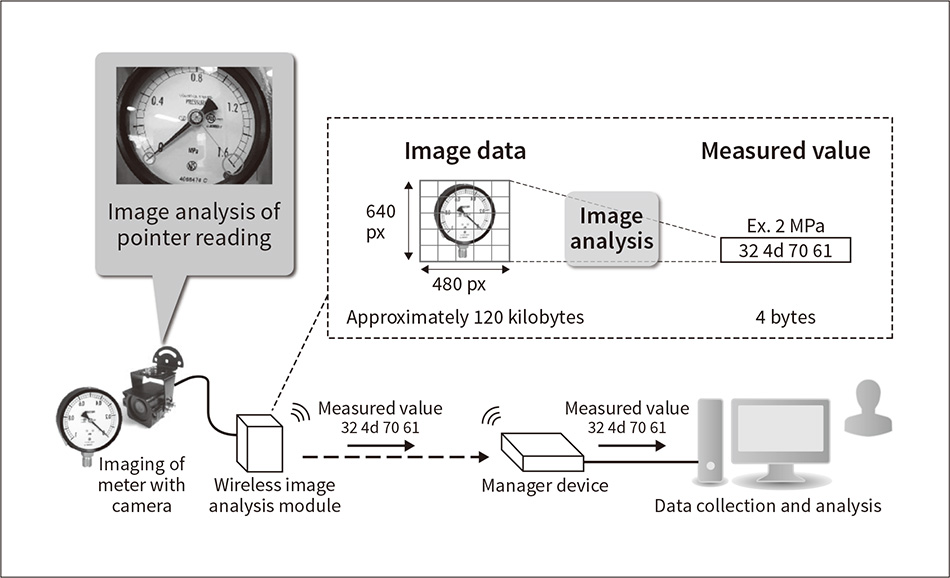 Because there is a large volume of image data when transmitting raw data via a wireless network, long-term operation using batteries is difficult. By processing the images in the wireless image analysis module and transmitting only the meter readings, the volume of transmitted data can be reduced to approximately 1/30,000 of the original volume.
Figure 4—Effectiveness of Wireless Module Power Reduction Using Image Analysis and Power Supply Control
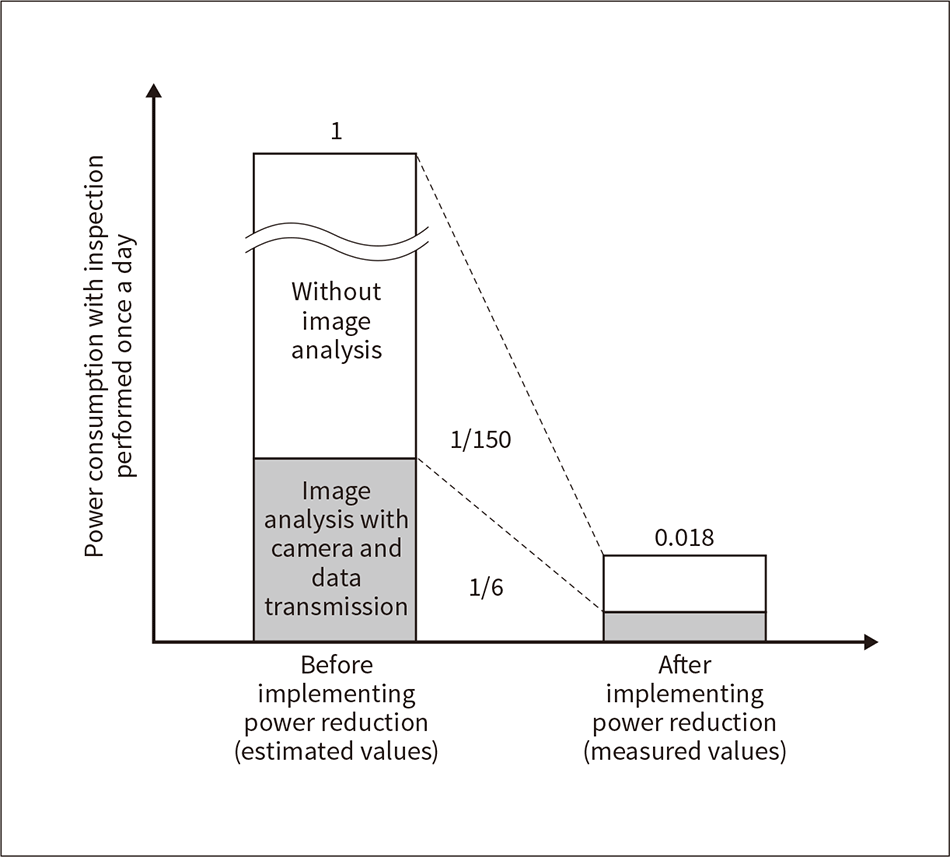 If the power consumption before reducing power using image analysis and power supply control technology is 1, then power consumption can be reduced to as little as 0.018, or approximately 1/56.
Some analog instruments, such as those in factories, are installed in locations with difficult work environments, such as outdoors or in high locations. Therefore, it is preferable that maintenance such as replacing batteries is not required for as long as possible after installing the wireless image analysis modules. However, the wireless modules contain many parts such as sensors, and all of these consume power when operating. In addition to reducing the volume of data transmitted through image data analysis as described in the previous section, it is necessary to reduce the power consumption for operating all of these parts to enable the modules to operate independently for a long period of time.
To achieve this, Hitachi focused on intermittent operation, so that a wireless module performs only a few asset inspections per day, and optimized the entire circuit in the wireless module for intermittent operation to deliver operation with low power consumption. It accomplished this by dividing the power supply block between each circuit block of the wireless module to construct a circuit that can control the power supply status individually for each circuit block. As a result, power is controlled so that it is supplied to only the circuit blocks that need it, according to the operation.
For example, power is supplied to the image analysis unit when taking measurements. The powered analysis unit supplies power to the camera and then shuts off the camera power after the image is acquired. Then, when the analysis is completed, the data are sent to the MCU. The power supplied to the analysis unit is shut off after the data is sent. In this way, power consumption is reduced through “normally-off” operation where the power supply status is controlled for each circuit block, only the parts that actually require operation are operated, and the parts are only powered for the required amount of time.
Figure 4 shows the results of reducing the volume of transmitted data using image data analysis as described in the previous section and reducing the power consumption using power supply control.
The power required for data transmission is reduced to one-sixth using image analysis and power consumption during standby is reduced to 1/150 using power supply control. The power consumption of the wireless image analysis module as a whole is reduced to approximately 1/56. From these measurement results, it can be understood that when inspection is performed once a day, operation with only a built-in battery is possible for three years, which covers several periodic inspection periods.
Figure 5—Wireless Network Management Screen
 The topology of a wireless network and communication quality at the installed locations can be visualized and managed in real time.
The wireless network is highly reliable due to factors such as spatial redundancy and frequency redundancy, and a mainstream method using the 2.4 GHz band has been used to enable easy adoption worldwide. The installed wireless modules communicate with each other using this method, automatically forming a wireless mesh network in which up to 100 nodes communicate with each other. Multi-hop transmission of data is performed between the wireless modules, which enables data collection without installing any cables even at a large site up to several hundred square meters.
This wireless mesh network is managed by a manager device. Figure 5 shows an example of the management screen. In addition to visualization of the topology of the wireless network and communication quality, this management screen can be used to check battery levels and to set the data collection frequency for each monitoring target. These functions enable the system to be set and adjusted quickly, even at a large site, and allow interactive management and operation of the system.
Figure 6—Example of Data Obtained by Inspection Automation System
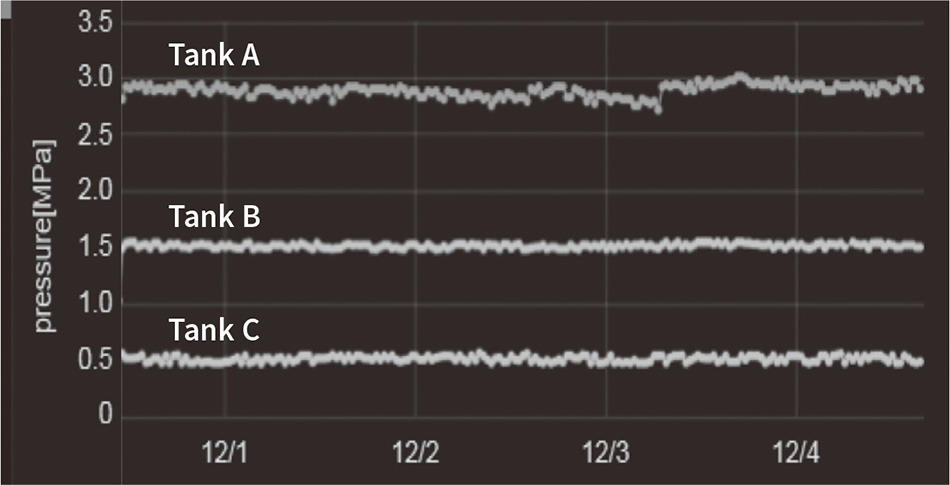 By visualizing the obtained data, trends can be understood in a way that was not possible with conventional visual inspections.
Utilizing the measured values collected by the manager device makes it possible to digitize inspection work. Figure 6 shows an example of using the developed inspection automation system to digitize the readings of pressure gauges installed on three tanks at a factory. While the pressures of tank B and tank C are mostly constant, the pressure of tank A shows a slight decline up to December 3. The figure shows that, after maintenance was performed on December 3, the pressure of tank A returned to its original level and then stayed constant. This shows how digitization makes it possible to understand trends in a way that was not possible with conventional visual inspections and how this information can be utilized to make asset maintenance management more efficient.
Furthermore, by combining data that has been collected in the past, such as temperature and electric current readings, with the data collected by an inspection automation system and analyzing them together, new service solutions can be expected to be developed, such as solutions that further increase the efficiency of asset operations.
This article has described a visual inspection automation system that enables the digitization of analog instruments installed in the field without requiring wiring work. Hitachi and its customers are currently working on a proof of concept (PoC) for this visual inspection automation system and on verifying the system while obtaining actual data.
The reading of round mechanical meters is used as an example in this article, but it will be possible to expand the image analysis targets and sensor types. The system is highly expandable not only to various plants that use analog instruments, but also to various other fields in which the hope for digitization had been abandoned because the installation of cable was too difficult.
In the future, Hitachi will implement and expand inspection automation systems to help contribute to the evolution of Social Innovation.
