Taking on Future Social Issues through Open Innovation
Life Science for a Healthy Society with High Quality of Life
Hitachi examined the possibility of using urinary metabolites to test for cancer. Although urine is over 90% water, it is thought to contain thousands of different metabolites, and it is not easy to measure subtle variations in the abundance of these metabolites between healthy volunteers and patients with cancer. To achieve this, a variety of different techniques must be used, including not only analytical techniques based on liquid chromatography and mass spectrometry, but also statistical techniques such as principal component analysis and heat map analysis of metabolites whose abundance differs between healthy volunteers and patients with cancer, metabolic pathway analysis techniques, unknown structure estimation techniques, and quantitative assay techniques. In short, Hitachi should use the full arsenal of metabolite analysis techniques. This article reports on the results of analysis of breast cancer and colon cancer cases.

Center for Exploratory Research, Research & Development Group, Hitachi, Ltd. Current work and research: Development and application of highly sensitive detection technology. Society memberships: Fellow of the Chemical Society of Japan, and IEEE.
At present, in vitro diagnosis is mainly performed using blood samples. In general, urine plays a major role in regulating the amount of water in the body and excreting waste material (metabolites) from the blood. This waste material consists of small molecules (metabolites) generated when using nutrients, and it is known that the abundance of metabolites in the body varies depending on the person's state of health. This property is used to test for conditions such as diabetes (glucose in the urine), arteriosclerosis (cholesterol), and gout/hyperuricemia (uric acid), but the number of testable items is much smaller for urine than for blood.
This report shows the results of a feasibility study on the use of urinary metabolites to screen for various types of cancer that are generally tested for using blood samples. This study focused on breast cancer and colon cancer.
The key feature of urinary metabolite analysis is that as many metabolites as possible are detected by analyzing a single specimen. It is therefore important to optimize the liquid chromatography separation conditions and the measurement of positive and negative ions in the mass spectrometer.
There are two main methods for obtaining urine samples for analysis.
For this analysis, Hitachi used the second of these methods to rapidly obtain samples from 15 healthy volunteers and 30 patients with cancer (15 with breast cancer and 15 with colon cancer). Specifically, Hitachi purchased frozen urine samples (about 10 mL per sample) from biobank companies called Indivumed GmbH (Germany) and Bio-options, Inc. (USA). These biobank companies are highly rated by medical practitioners.
For the comprehensive analysis of urinary metabolites, Hitachi used liquid chromatography/mass spectrometry (LC/MS). To generate ions for mass spectrometry (MS), electrospray ionization (ESI) was used in positive/negative ionization mode. Tandem mass spectrometry (MS/MS) is very useful for obtaining metabolite structure information that can be used to infer the structure of unknown metabolites.
On the other hand, since MS/MS cannot be limited to a single mode of separation at the stage where the properties of the urinary metabolites (e.g., hydrophilicity, hydrophobicity, ionicity when dissolved) are unknown, Hitachi decided to use multiple separation modes so that metabolites with a wide range of polarity could be analyzed.
The analysis of urinary metabolites involves measuring stable small molecules with molecular weights of a few hundred or so, which are thus easier to measure than other substances in the blood such as proteins. However, there are reckoned to be thousands of different metabolites, so various techniques are needed to analyze them. Figure 1 shows a comprehensive analysis scheme for urinary metabolites(1), (2).
Figure 1—Comprehensive Analysis Scheme for Urinary Metabolites
 The chart shows how candidate biomarkers are identified through comprehensive analysis of urinary metabolites from healthy volunteers and patients with cancer.
The urinary metabolites of healthy volunteers and patients with cancer were comprehensively analyzed by using LC/MS [see Figure 1 (2)]. In this analysis, ultra-high-resolution LC/MS was used that combined multiple separation modes (reversed-phase liquid chromatography and hydrophilic interaction chromatography) with positive and negative electrospray ionization, and a wide range of both hydrophilic and hydrophobic metabolites were detected with high sensitivity. After that, by collating the detected peaks against sources such as public metabolite databases, it was possible to efficiently select candidate biomarkers.
Hitachi performed heat map analysis to select metabolites whose abundance differed significantly between healthy volunteers and patients with cancer [Figure 1 (3) and (4)].
Based on these results, a type of multivariate analysis called principal component analysis was used to search for conditions where it is possible to distinguish between healthy volunteers and patients with cancer. Specifically, multiple metabolites were identified as biomarker candidates, and by principal component analysis, Hitachi introduced two or three variables based on new concepts and studied the conditions for distinguishing between healthy volunteers and patients with cancer. A type of machine learning called the random forest method was also used to select metabolites as candidate biomarkers by evaluating the contribution made by each metabolite.
According to the list of contributions made by biomarker candidates evaluated by random forest analysis, the results were correlated sources such as public databases, and it was clarified whether their structures were known [Figure 1 (5)].
For metabolites whose structure was known as a result of the database search, their metabolic pathways were analyzed to verify their relevance to the molecular mechanisms of cancer. If this result indicates relevance, then the substance becomes a biomarker candidate. On the other hand, for metabolites whose structure was unknown, Hitachi first estimated the structure from the MS spectrum or MS/MS spectrum [Figure 1 (6)].
An MS/MS spectrum is an MS spectrum obtained by performing MS again to measure the fragment ions produced by collisions between helium and the ions measured by the initial MS stage, and often includes an abundance of structural information about the measured substance. However, although there is ongoing research into estimating the structure of known organic compounds, it is difficult to infer the structure of organic compounds from their inverse MS and MS/MS spectra, and even if public databases are used, the results are highly dependent on the prior treatment of these compounds.
Based on the results of this investigation, Hitachi investigated a final analysis protocol for testing [Figure 1 (7)]. Specifically, the measurement targets were restricted to the biomarker candidate metabolites to be quantified, and the simplest possible analysis conditions and conditions for quantifying these metabolites were determined. Based on the results for a large number of specimens measured under these analysis conditions, healthy volunteers and patients with cancer were discriminated between by performing principal component analysis again and identifying which regions the calculated values of principal component analysis of the new specimens fell into. Therefore, in addition to developing analysis methods, it goes without saying that it is very important to consider the quality of multiple specimens (whether the healthy volunteers are truly cancer-free, and the stage of cancer in the patients diagnosed with cancer).
The principal component analysis is described in more detail below. Based on the heat map analysis results, principal component analysis was performed by using the variance–covariance principal component analysis method. Unlike conventional tumor marker tests, the biomarkers are assumed to consist of multiple metabolites, so principal component analysis that aggregates multivariate information into fewer variables is very effective.
Figures 2 and 3 show some examples of the principal component analysis results. Figure 2 shows the results of calculations using about 10 different biomarker candidates with three principal components (contributions: principal component 1: 74.28%; principal component 2: 18.09%; principal component 3: 7.63%). Healthy volunteers can be distinguished from patients with cancer (breast cancer and colon cancer). On the other hand, Figure 3 shows a two-dimensional representation of each combination of principal components. Since the degree of discrimination increases when there is a principal component that makes a large contribution, there may be cases where this sort of two-dimensional representation is insufficient. However, such two-dimensional analysis is easier to apply to actual cancer tests. For example, by using the results of analyzing principal components 1 and 2 in the same figure, it is easy to set a threshold value to discriminate between healthy volunteers and patients with cancer.
These results show that urinary metabolites can be used to discriminate between healthy volunteers and patients with cancer, demonstrating the possibility of detecting cancer with a urine test. The cancer tests hitherto used for in vitro diagnosis have mainly involved measuring biomarkers such as proteins and sugars in the blood. If urine tests become possible, then sample collection will become far easier. This could revolutionize the social system for cancer screening.
On the other hand, while biomarkers in the blood have hitherto been tested based on one test per biomarker, biomarkers in the urine correspond to multiple biomarkers (metabolites). This conceptual difference should be kept in mind when developing test methods in the future. However, this is expected to alleviate the drawback of conventional methods whereby tumor markers may fluctuate due to factors unrelated to tumors.
Figure 2—Example of Principal Component Analysis Results for Urinary Metabolites in Healthy Volunteers and Breast Cancer/Colon Cancer Patients (Three-dimensional Representation)
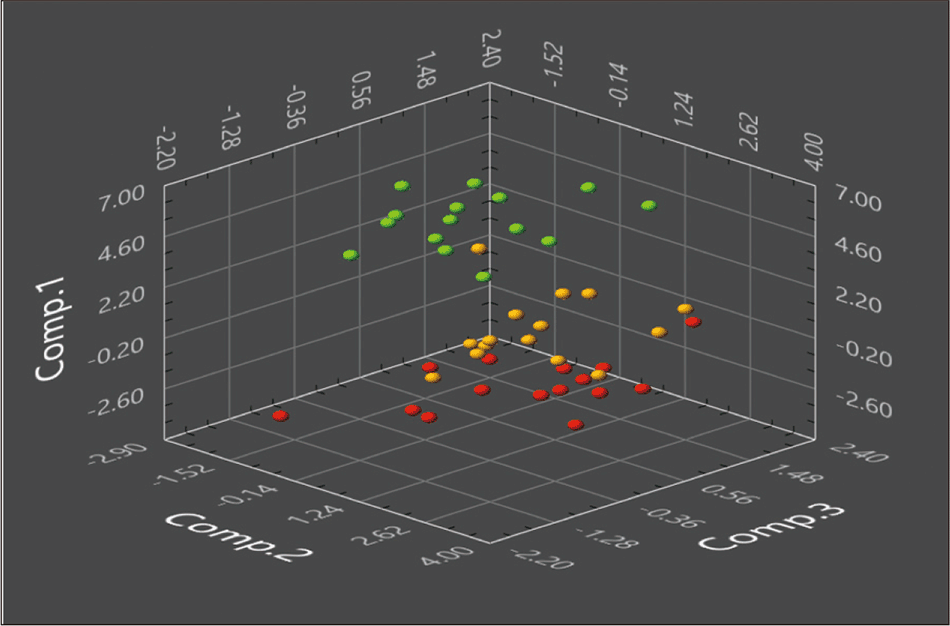 This shows a three-dimensional plot using about 10 biomarkers. Healthy volunteers are indicated by green, breast cancer patients by orange, and colon cancer patients by red.
Figure 3—Example of Principal Component Analysis Results (One- and Two-dimensional Representation) for Urinary Metabolites in Healthy Volunteers, Breast Cancer Patients, and Colon Cancer Patients
 This shows one- and two-dimensional plots using about 10 biomarkers. Healthy volunteers are indicated by green, breast cancer patients by orange, and colon cancer patients by red.
Hitachi examined the possibility of using urinary metabolites to test for cancer. For practical applications, further research based on clinical data is required. However, the feasibility of this approach was confirmed by introducing the concept of multiple biomarkers, unlike conventional tumor markers. In cooperation with medical institutions, Hitachi will continue to research this method, including the possibility of detecting various types of cancer.
This research was supported by the 2015 Acceleration Transformative Research for Medical Innovation Program (ACT-M) of the Japan Agency for Medical Research and Development (AMED).
