Creating Smart Rail Services Using Digital Technologies
Big Data Discovery and NX Context-based Data Management System
Today’s clients are looking to IoT and big data-related business applications to utilize data as a means for creating more advanced maintenance methods, for optimizing operations, and for developing new services. These expectations are prevalent among industries with manufacturing plants and among public infrastructure providers in sectors such as rail transport, power, and gas. This article presents two products provided on the Hitachi Data Science Platform that help prepare data for utilization—Big Data Discovery and the NX Context-based Data Management System. The Hitachi Data Science Platform provides clients with comprehensive assistance for data utilization. Customers can utilize it to create a data-gathering environment or a data lake for unified data storage. It can also provide assistance with preparing data for utilization, along with AI- and BI-driven data analysis services and application development.


Operational technology (OT) data that can be acquired from sensors mounted in various devices used at sites comes in many different formats. IT data is often managed using different data items or names for each business system even when the information it provides is the same. Utilizing these different types of data together requires preliminary preparations such as integrating data, standardizing formats, and standardizing units of measurement. Not knowing where the data they need is located, user departments that want to utilize data call on system departments to provide it. But siloed systems make data-gathering a labor-intensive process for the system departments also.
Hitachi has developed two products designed to reduce the workload needed for data preparation: Big Data Discovery (BDD) and the NX Context-based Data Management System (CDMS). BDD enables efficient extraction and creation of the required data from massive amounts of data in a wide range of formats, while CDMS enables reconfiguration and management of OT data from the user's perspective. These products assist with preliminary data preparation to enable integrated analysis and utilization of OT and IT data. BDD and CDMS are provided as collected data preprocessing/visualization and management service functions on the Hitachi Data Science Platform (DSP) (see Figure 1).
Figure 1—Schematic Diagram of Hitachi Data Science Platform (DSP)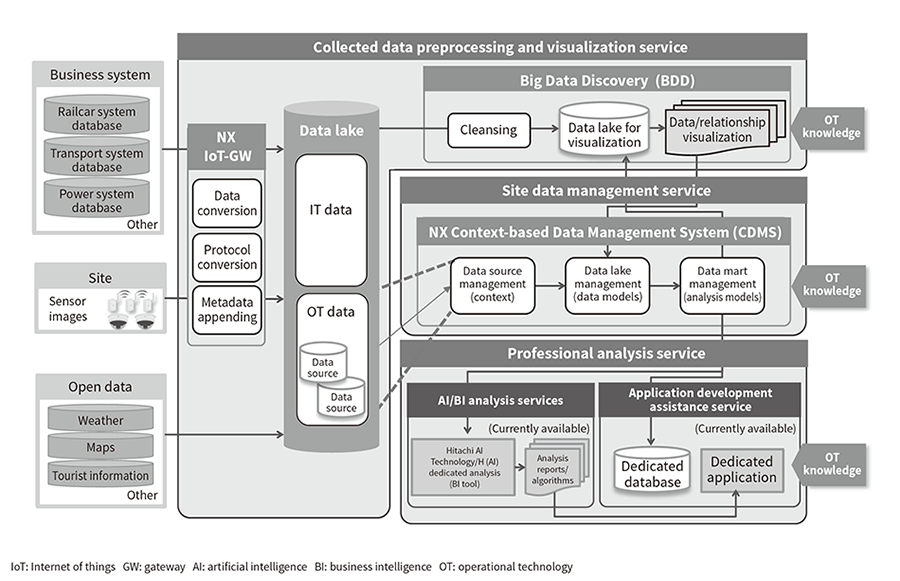 DSP provides three products/services designed to give clients comprehensive assistance with data use: (1) The collected data preprocessing and visualization service provides an NX IoT gateway function and BDD function. The NX IoT gateway function gathers sensor data from plant facilities and devices. The BDD function enables rapid merging/extraction of data for utilization by automatically visualizing data relationships among gathered OT data and IT data acquired from systems. (2) The site data management service provides an NX CDMS function that makes it easy to utilize site data by defining the meanings of analysis data items and managing models. (3) In the future, the professional analysis service will seamlessly coordinate AI and BI with DSP to provide services assisting advanced analysis and dedicated application development.
One solution for giving data users unrestricted utilization of data is to enable them to acquire the required data themselves. But this approach results in complex data acquisition methods and requires a solution to the issue of the extensive time needed for data acquisition processes. This section discusses the product that Hitachi has created to solve these issues, BDD.
User departments that want to utilize data must perform complex procedures such as obtaining data usage permission for each data management department or asking for assistance from system departments. Only after completing these complex procedures can they eventually obtain the data. To solve this issue, Hitachi has devised an approach in which data is gathered in a single location and users are given the ability to acquire data themselves using a standard interface for all data types (see Figure 2).
Figure 2—Improved Data Acquisition Method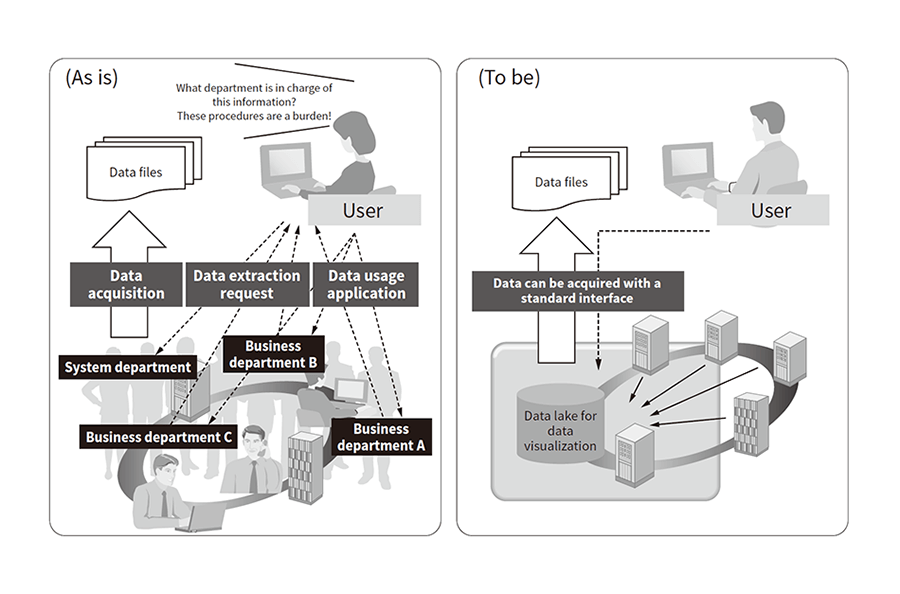 User departments must currently complete complex procedures before they can eventually obtain data. To improve this situation, users need to be able to acquire data by themselves using the same standard interface for every type of data.
Currently, the data for utilization is often generated using processes that are individually optimized for each system. Individual processing capacities are becoming inadequate due to data bloat and the large number of output data file types. Systems that handle big data should ideally have a configuration that makes it easy to expand processing capacity to keep up with data volume growth. It should be possible to resolve this issue by creating an environment that enables rapid data file input/output using distributed processing technology (see Figure 3). BDD has been designed to provide this solution. It uses the Hitachi's distributed processing platform product Hitachi Application Framework/Event Driven Computing (HAF/EDC).
Figure 3—Improved Data Acquisition Process Time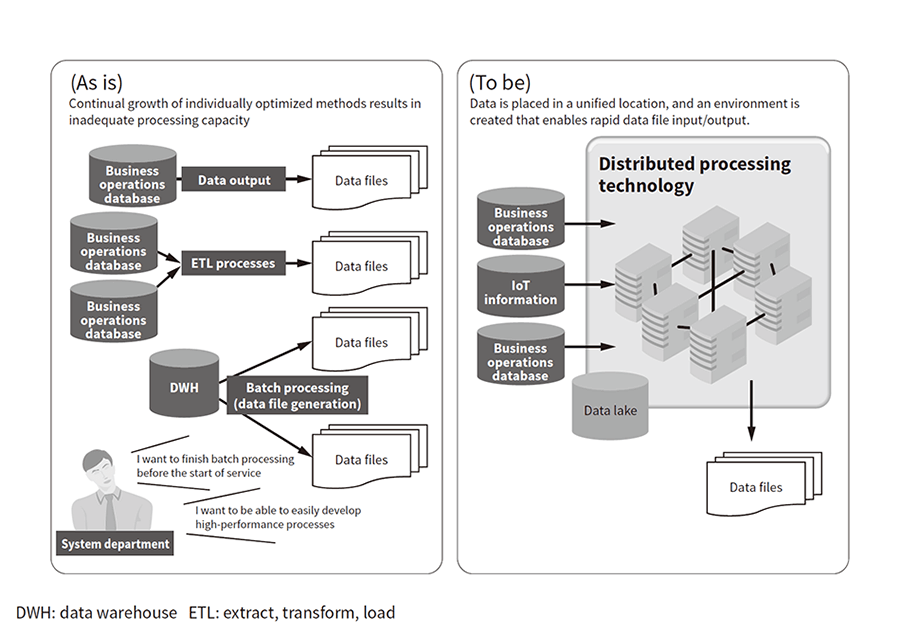 Distributed processing technology can be used to enable rapid data file input/output, resolving the issue of extensive data acquisition process time.
Figure 4—Viewing Data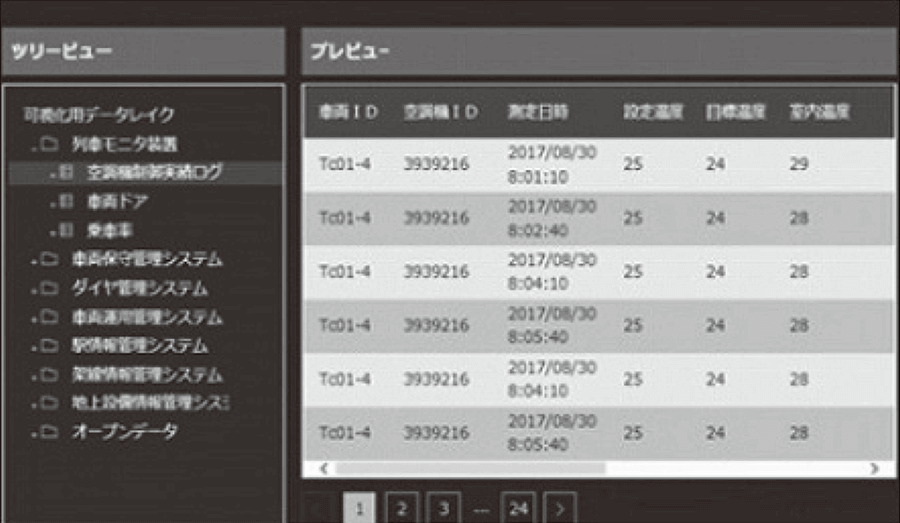 Data is read on a viewer to check for effective data items.
Figure 5—Searching Data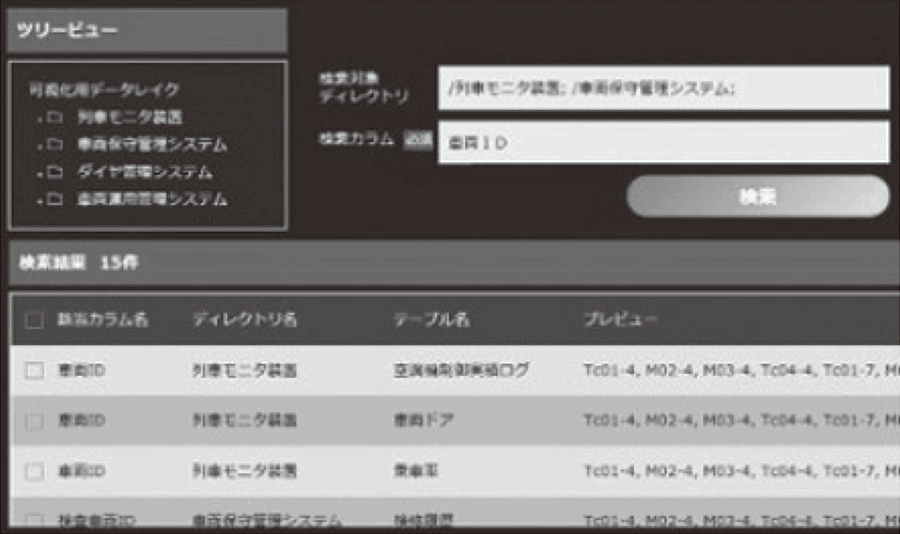 The name of the data item of interest is entered as the search key, and effective data items are selected by performing a fuzzy search spanning multiple systems.
Figure 6—Linking Data The user can determine whether a data item is worth using by selecting a merge key and using it to view graphical representations such as relationship diagrams, appearance frequencies, histograms, and scatter plots.
Figure 7—Creating Data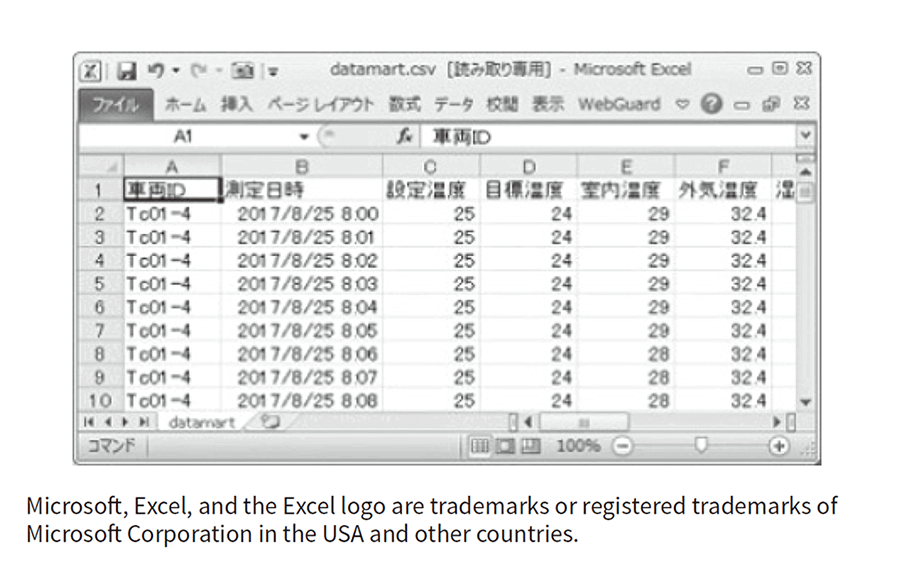 Data determined to be worth using is output in a format enabling easy handling, and subsequently used in analysis activities and other processes.
BDD provides a function for automatically displaying the relationship between data from different systems, and can search massive volumes of gathered data to find columns having similar names to columns of interest to the user. Its ability to easily extract data genuinely worth using enables a reduction in the workload needed to prepare data for utilization, letting the user to quickly get started with actual data utilization or another task at hand. BDD is an application for viewing, searching, linking, and creating data. Just by having the data manager load the data files, the user can check the data (data viewing), display related network diagrams (data linking), and perform other activities automatically.
This section describes the data management platform designed for OT data utilization in offline analysis and online applications. Many different types of equipment and sensors are found at sites. The data-gathering timing and format varies with each sensor, and sensors are managed by many different site systems. As a result, OT data has been previously handled by only experts familiar with on-site systems. Investigating the types of data present at a site is a time-consuming task for the analysts who utilize OT data, and site system operators bear the burden of gathering and providing OT data whenever analysts attempt a new analysis. This section describes CDMS, a product designed to solve these issues and to enable rapid implementation of analysis and applications.
CDMS provides three data management levels consisting of data accumulation, organization, and utilization (see Figure 8).
Figure 8—CDMS Configuration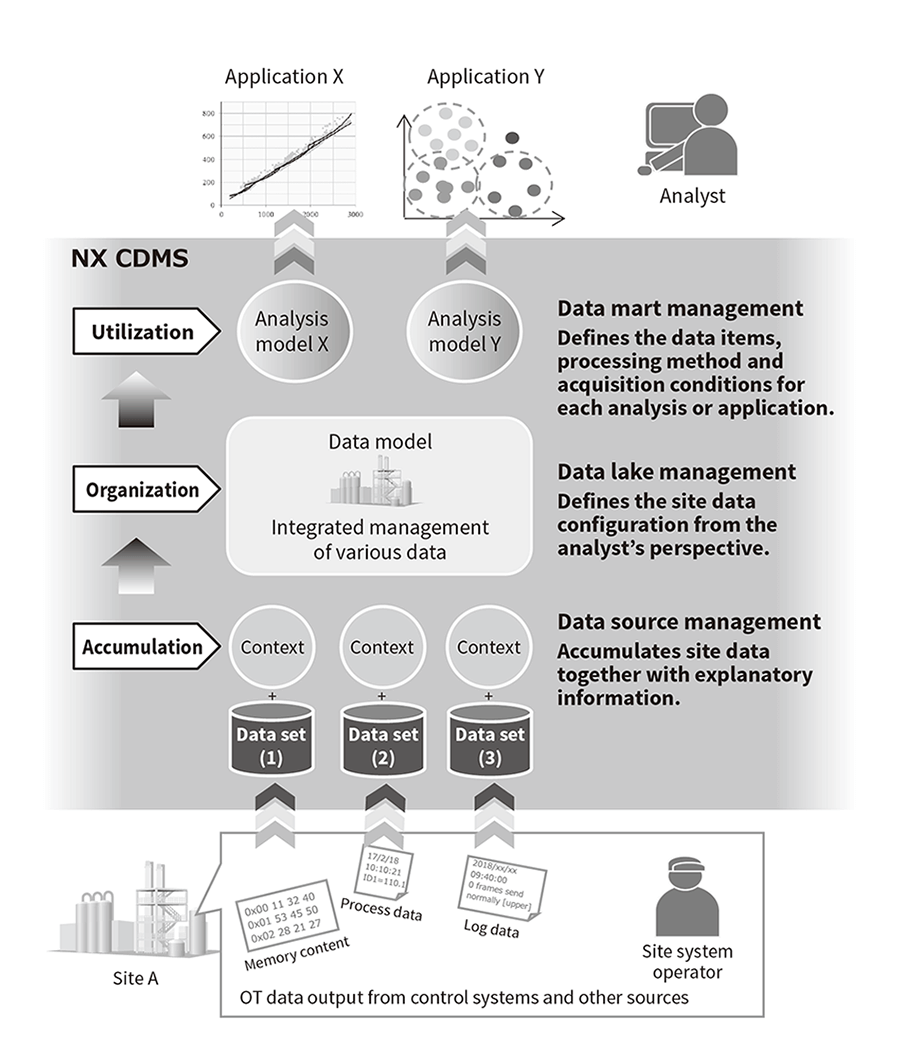 CDMS provides three data management levels consisting of data accumulation, organization, and utilization. It makes OT data handling easy even for analysts without in-depth knowledge of site systems. Additionally, it also eliminates the need for site system operators to gather and provide the data generated by each new analysis.
Figure 9—Data Organization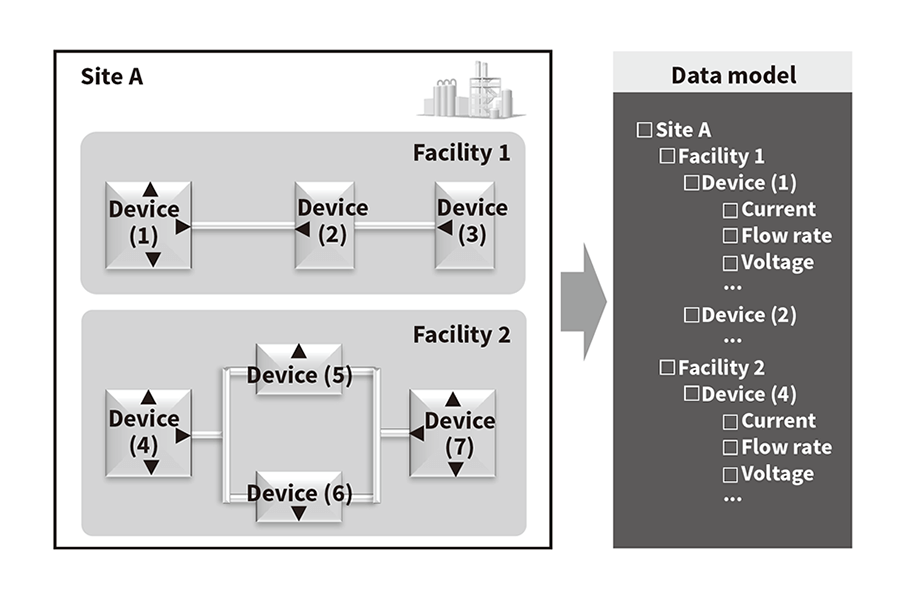 The configuration of the sensors attached to each facility and device in a building is defined as a data model. Tracing through data models lets analysts understand the type of data present at each location on site, and access the data of interest.
As mentioned above, managing data with CDMS enables easy utilization of OT data. However, it is difficult to make a big investment in large-scale data management from the beginning. So, a data management platform is required to support gradual expansion as it operates. The required data volume will increase as the scope of analysis expands, and introducing new analysis methods and applications will create the need for data in new formats. CDMS makes it easy to add data and new analysis methods or applications by defining a data source, data lake, or data mart with the graphical user interface (GUI). The HAF/EDC, distributed processing platform, also lets users expand their central processing unit (CPU) capacity without shutting down systems, to accommodate increases in server processing volume as handled data or analysis applications increase.
Implementing the utilization of data ultimately creates new business value in the form of improved productivity and increased earnings. Clients who actively embrace the utilization of data have conducted individual analysis activities for proof of concept (PoC) purposes and other reasons, but most of them have been one-time-only experiments. This lack of follow-up has occurred partly because the workload for preparing the data is greater than for the actual data analysis, and companies are unused to doing these activities on an ongoing basis.
BDD lets data users search and present large amounts of data to discover data worth using and output it in easily handled formats. It is hoped that the use of BDD will help reduce the data preparation workload and promote more advanced data utilization. CDMS lets data users understand the meaning of data known only at the site by assigning appropriate attribute information to it in advance. CDMS will help create benefits such as reducing accidents and stimulating the utilization of OT data. Hitachi will continue improving the functions of DSP so that it can be used to extract new value-creating data structures (with BDD), and help create ongoing value-creating data/analysis cycles in corporate activities (with CDMS).
