GLOBAL INNOVATION REPORT
Promoting investment in rail transport infrastructure, Australia presents a range of attractive opportunities for technology and service innovators. Anand Singh, Executive Director & Director Operations, Hitachi Australia Pty Ltd. provides an overview of Australia's evolving railway infrastructures and its circumstances.
Australia – ranked 13th in the world by gross domestic product (GDP) in 2017(1) (making its economy bigger than that of many populous countries) – presents a range of attractive opportunities to technology and service innovators, especially those focused on the infrastructure sector. A combination of factors is changing the scale and nature of infrastructure in the country (see Figure 1).
The population projections for the country suggest an additional 11.8 million people will be added between 2017 and 2046(2). More importantly, around 75% of this growth will be in the major cities of Sydney, Melbourne, Brisbane, and Perth(2). The numbers may seem small in the global context, however for Australia this represents 50% growth in population (see Figure 2).
This growth translates into a significant burden on the infrastructure of the country – roads, rail, ports, airports, and utilities (water, telecommunications, and energy), as well as social infrastructure (hospitals and educational institutions).
In 2016, 3.7 million (15%) of Australians were aged 65 and over(2). By 2056, it is expected there will be 8.7 million older Australians, making up 22% of the population(2). This impacts not only specific social infrastructure (such as hospitals and aged care facilities), but also transport infrastructure including connectivity and accessibility to public transport modes.
Australia has one of the highest per capita emissions in the world. Despite increases in renewable energy generation (particularly solar and wind), greenhouse gas emissions from cars and light commercial vehicles have been growing at an annual rate of 2% or more, driven by the lack of a mandatory motor vehicle fuel efficiency standard and slow uptake of electric vehicles (EVs) in the country.
The increased leverage of cloud computing, mobile device use, big data analytics, the Internet of Things (IoT), and improved connectivity is resulting in the digital transformation of a range of infrastructure sectors globally and in Australia. This is seen particularly in the development of smart buildings and precincts, smart hospitals, and also intelligent mobility solutions.
The strength and resilience of the Australian economy is highlighted by the fact that 2017 marked the 26th year of consecutive economic growth(3). Australia is the only major developed economy to have recorded no recessions from 1992 to 2016(3).
GDP growth for 2018 is projected at 2.96% and for 2019 at 3.08%(4). GDP per capita is also projected to grow steadily to 2023 (see Figure 3).
Australia's social fabric is being transformed by a number of shifts including growth in the migrant workforce (over 80% of the growth in the Australian workforce over 2011 to 2016 came from migrants)(5), the increased popularity of part-time employment, the growth in knowledge worker and service jobs, and the growth in the sharing, collaborative, and on-demand economy (highlighted by the popularity of services such as Uber*1, Airbnb*2, Kickstarter*3, and Coursera*4). Each of these social shifts has specific implications for infrastructure. For example, the shift to increased part-time employment has specific ramifications for public transport scheduling, frequency, and coverage.
Figure 1—Factors Impacting the Future of Infrastructure in Australia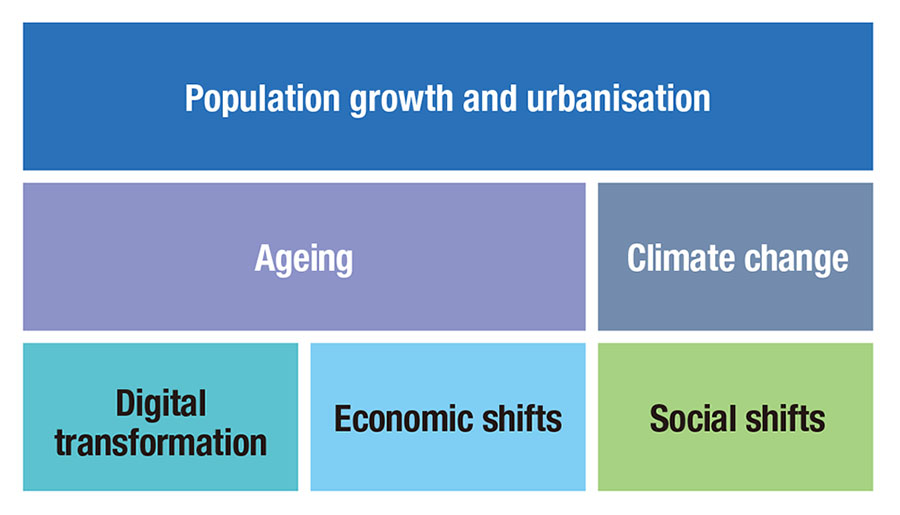
Figure 2—Australian Population, 2016 and 2046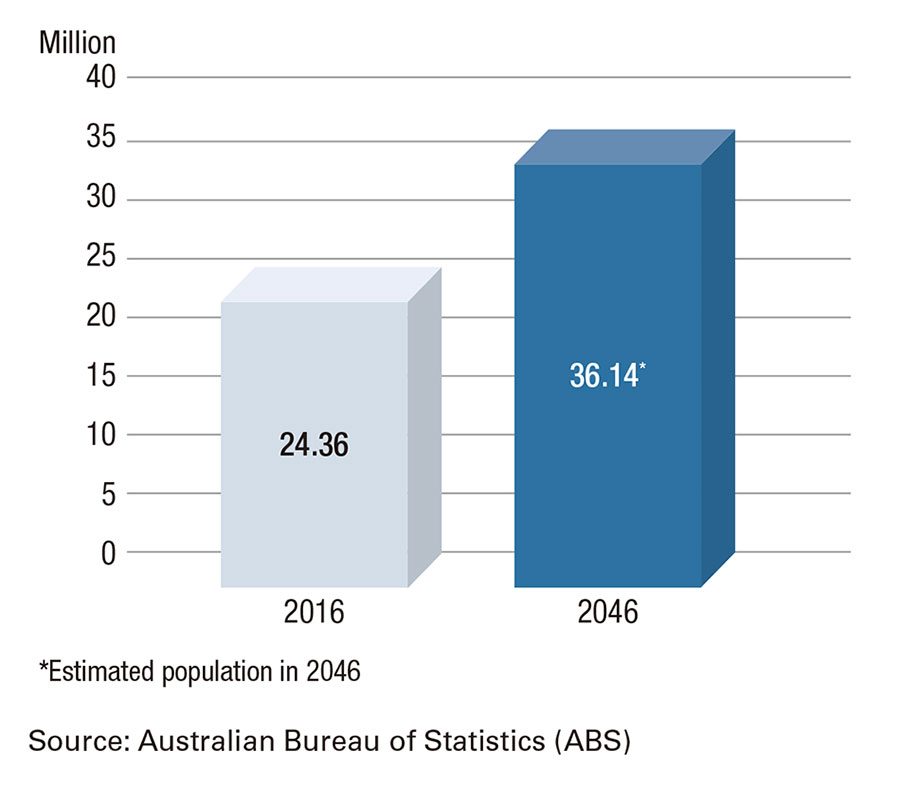
Figure 3—Australian GDP per Capita, 2017 to 2023
Investment in rail transport infrastructure is being driven by a combination of factors:
Congestion presents a significant productivity challenge for the country. The avoidable social costs of congestion in the eight Australian capitals are expected to grow from A$16.5 billion in the 2015 to A$30 billion by 2030, in the absence of measures to cut congestion(6). Against this background, the fact that one passenger train equates to taking 525 cars off the road(7) makes this mode a significant part of future urban planning.
Rail projects are driven by government policies designed to reduce road congestion and incentivise commuters to use mass transit. Government policy plays a significant role in providing access to capital to fund large infrastructure projects. For example, A$10 billion was announced in 2017's Federal Budget for the National Rail Program to invest in passenger rail networks in big cities, and between cities and their surrounding regional centres (see Figure 4).
Australia is the world's 11th largest international tourism market, and tourism receipts contribute more to the Australian economy (2.4 % of GDP) than the world average(8). International arrivals into Australia grew 53.1% from 5.6 million in 2006-2007 to 8.6 million in 2016-2017 and are expected to grow by 75.3% between 2016-2017 and 2026-2027 to reach 15.0 million in 2026-2027, driven by continued growth from markets such as China, New Zealand, India, and others. Domestic visitors are expected to grow by 24.7% between 2016-2017 and 2026-2027 to reach 421.4 million in 2026-2027(9). Increased rail transport infrastructure not only helps to support tourist movements in the country, but also improves the overall liveability and attractiveness of Australian cities to global tourists.
With A$198 billion in exports in 2016-2017, the mining sector accounted for over 50% of Australia's total export income(10). Continued demand for metal and mineral commodities and liquefied natural gas (LNG) will underpin Australia's resource export earnings over the medium term. Over the long term, the mining sector is likely to benefit most from opportunities in the materials used in advanced technologies such as batteries and smartphones (materials such as lithium, vanadium, cobalt, and rare earths). As of October 2017, there were 41 committed major resource projects with a combined value of A$122.4 billion(11). As a result, port and rail line infrastructure spend is likely to be sustained.
Reducing freight congestion on roads, reducing road wear and tear, and reducing transit time are key factors driving the shift of freight off roads and to rail. The average freight train takes 110 trucks off the road(12). In Australia, the proliferation of free trade agreements (FTAs) and the continued strong performance of large export-oriented sectors (including mining, LNG, and agri-food) has helped stimulate freight activity.
Road travel is estimated to cause close to eight times more accident costs per kilometre than rail(13). In addition, road passenger travel generates over 40% more carbon pollution than rail travel for each kilometre travelled(13). Similarly, road freight results in 14 times more accident costs than rail freight per ton-kilometre and 16 times the carbon pollution of rail freight per ton-kilometre(13).
The drive to use integrated mobility as a means of improving connectivity for commuting and freight, as well as improved logistics efficiencies, is resulting in increased focus on the integration of country and regional transport networks and multi-modal network projects. This is aided by the development of integrated digital platforms and services offering door-to-door mobility, as well as by land planning and city planning that is informed by holistic “smart city” objectives.
Figure 4—A $10 billion Transformational National Rail Program from 2017-2018 to 2026-2027
As a result of these drivers, construction activity in the Australian rail sector is showing a positive growth trend (see Figure 5). By 2030, combined commonwealth, state and territory government investment in rail is expected to exceed A$100 billion(14). This is underpinned by increased patronage of heavy and light rail, as well as the growing role of rail freight for both bulk and non-bulk goods. In 2016, the rail sector's economic contribution to GDP was A$26 billion, with 142,288 full-time-equivalent employees (FTEs) in its workforce(15).
Figure 5—Railway Engineering Construction Work Done, Australia, 1997 to 2017

Australia has the sixth largest rail network globally, the largest light rail system, and operates some of the heaviest and longest freight-trains(16). In terms of enabling technologies, the country has already established an “early adopter” position in the deployment of driverless trains and remote operations centres for the mining sector.
Increasing operation and maintenance costs are resulting in increased fares for urban rail passengers, a reactive maintenance approach, service disruptions, and reduced train availability. Hitachi has the capability to deliver asset maintenance solutions. These enable predictive and targeted maintenance practices, thereby ensuring assets maintain the highest availability and performance whilst also ensuring optimal resource allocation and improved cost of service.
One of the most visible consequences of capital expenditure constraints is overcrowding on urban train networks. Average passenger loads on Sydney Trains during the morning reached 120% of capacity in September 2017 (up from 112% the year before). In fact, between 8am and 9am on weekdays most trains on the Sydney network are at 185% capacity(17). In June 2018, trains in Sydney were late or skipped stations 79% of the time(18). Hitachi has the capability to use data analytics to help clients achieve improved performance from existing assets. One example is Dynamic Headway (by monitoring passenger demand at stations and using real-time scheduling technologies, train services can adapt to meet passenger demand, thereby reducing overcrowding and improving punctuality and customer satisfaction).
Hitachi is delivering new digital signalling and operational technologies that help clients achieve the highest levels of safety. This includes technologies such as the European Train Control System signalling system and traffic management systems. As the rail industry evolves, these two technologies combined with automatic train operation, will enable clients to operate fully integrated, driverless rail networks.
As emerging countries with lower operational costs challenge Australia in the global mining markets, there is a critical need for advanced infrastructure in remote areas of the country and for a reduction in asset life cycle costs. Hitachi has delivered the complete autonomous train technology that allows miners to run their trains in a full driverless mode that optimises the use of rail infrastructure, allowing a 24×7, 365-days-a-year operation with the highest level of safety. The same technology provides a driver assist mode that substantially reduces the stress and demands on train drivers as an intermediate step to full driverless mode.
The Australasian Railway Association's(ARA) “National Rail Industry Plan for the Benefit of Australia” has identified technology focus areas with a view to addressing the challenges facing this sector (see Figure 6).
Figure 6—Technology Focus Areas for the Australian Rail Industry
A brief review of the trends evolving in the region provide an ideal platform for key stakeholders, including the government and business, to come together to identify and bring about changes that influence quality-of-life. Enhancing the rail infrastructure, as can be noted from this report, forms a significant part of this change. From Hitachi's perspective, the opportunity to be a part of this transition aligns with a commitment to the United Nations Development Programme's Sustainable Development Goals (SDGs), and Hitachi is working with the government to achieve its objective of improving quality-of-life through the provision of better infrastructure and living.
To further reinforce Hitachi's participation, the drivers and related growth in rail infrastructure in recent years provide tangible evidence of the benefits of continuing to enhance the rail infrastructure in the country. While the challenges of the region are unique, they do provide opportunities for businesses to adopt innovative solutions, in alignment with Hitachi's core values.
Given Hitachi's plans for global growth and for its railway business in particular, Australia presents an opportunity to be aligned with a region that ranks among the top 15 in the world for “ease of doing business” (according to the World Bank). With a demonstrable track record as a pioneering, total railway solutions provider globally, Hitachi is well positioned to become a strategic partner with government and rail operators to help realise the vision of smart transport infrastructure for Australia.
