Water Environment Solutions that Facilitate Ongoing Use of Water Resources
A growing number of regions are facing water shortages as a result of climate change and due to the uneven distribution of freshwater resources. Meanwhile, even in places with a well-developed water supply infrastructure, a shortage of skilled operators due to retirement is emerging as a problem as populations age. Hitachi has much experience utilizing its expertise in information processing and equipment design to address these challenges. This article describes a technique for optimizing the flocculant dosing rate in the water treatment process by using machine learning, which requires experienced staff, and also a system that improves the recovery rate of seawater desalination to produce more fresh water from a given size of plant.


The uneven distribution of fresh water resources due to differences of geography and rapid climate change over recent years, mean that many regions will be facing increasingly severe water shortages in the future. Figure 1 shows the changes in the severity of water shortages over the period from 2010 to 2050(1). A large number of regions of Africa and the Middle East are expecting greater water shortages in the future, and Asia, South America, and North America are also facing the same risk. These regions need to acquire new sources of water such as seawater and treated wastewater, depending on their geographic situations. In Japan meanwhile, the concern is that a shortage of engineers caused by changing demographics will impede the operation of water infrastructure(2). To resolve these challenges, Hitachi is using information technology to deskill plant operation and is improving its design techniques for seawater desalination plants. This article describes these technologies.
Figure 1 — Projected Changes in Water Shortages by 2050 Relative to 2010 The map shows predicted changes in the severity of water shortages in different parts of the world through to 2050, with 2010 as a baseline. Shortages are projected to become increasingly severe in Africa and the Middle East, with growing shortages also forecast for Asia, South America, and North America.
As the water treatment market in Japan experiences ongoing privatization and consolidation driven by falling populations and the difficult financial situation of local government outside the main cities, hopes are being placed on the use of information and communication technology (ICT) to help pass on operation and management know-how, to provide better training tools, and to enable deskilling.
Hitachi has been working on proposals to address these challenges by using artificial intelligence (AI) to better manage how much flocculant is used at the water treatment plants it has been contracted for operation and maintenance(3). Determining how much flocculant to add has in the past been treated as a skilled task, with quantities being adjusted in proportion to current water quality and based on past experience. Unfortunately, skill shortages are emerging as a problem at these plants as their staff get older. Accordingly, to better manage the level of flocculant dosage at water treatment plants, Hitachi has developed a method for estimating appropriate dosage that works by applying machine learning to historic operating data.
Figure 2 shows a process flowchart of a water treatment plant. The raw water is pumped from a river by an intake pump and flows out to a rapid-mixing tank where it is mixed with a flocculant, which is an agent that causes colloids and other suspended particles in the water to aggregate, forming flocs. The water then spends about 30 minutes in a flocculation tank for the flocs to form. These flocs then settle out of the water over a period of several hours in a sedimentation tank.
While increasing flocculant dosage reduces the turbidity of the treated water and improves the quality of the water supply, it increases costs. The operators adjust the flocculant dosage based on a target for the turbidity of the treated water that is chosen so as prevent the turbidity from exceeding the contracted level.
The result of this flocculant dosage at the moment is not known until the process of sedimentation has completed several hours later. This makes flocculant dosage a skilled job with the quality of the intake and treated water being compared on the basis of current water quality and past experience. Operation is particularly difficult at the water treatment plant used here as an example because it draws its water from a river, the water quality varying widely depending on the time of year.
Figure 2 — Process Flow Chart of Water Treatment Plant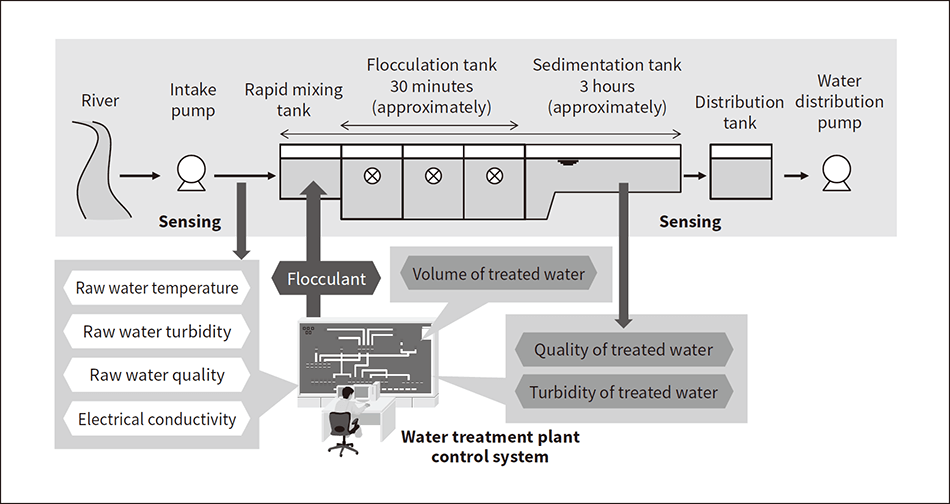 Flocculant dosages are adjusted based on a target turbidity chosen so as prevent turbidity from exceeding the contracted level. While increasing flocculant dosage reduces the turbidity of the treated water and improves the quality of the water supply, the increasing flocculant dosage adds to costs.
Figure 3 — Results of Cluster Analysis of Operational Records (Time Series Data)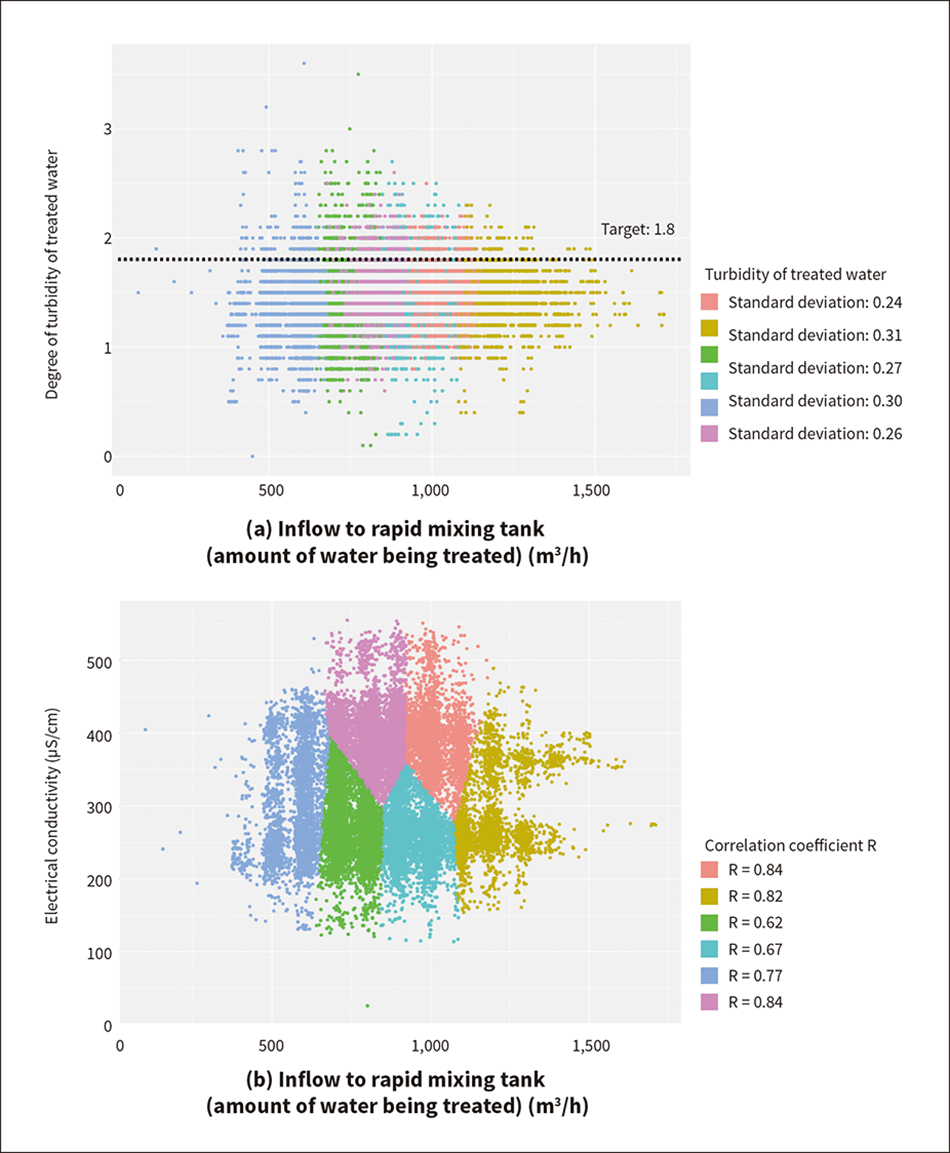 The analysis was performed for data collected between April 2013 to December 2016. One cluster analysis record corresponds to one hour of operational data.
The first step was to confirm that cluster analysis could be applied to operational records to group the trends in actual data on water quality control. These records were made up of time series data for a number of operational variables. To enable their use for the analysis of flocculant dosage, cluster analysis was used to group the multi-variable data into separate datasets that exhibited similar patterns.
Figure 3 shows the results of cluster analysis. The standard deviation of the turbidity of the treated water narrows as the volume of water being treated increases (0.31→0.24) and the turbidity converges on its target value of 1.8 [See Figure 3 (a)]. Similarly, the correlation coefficient improves as the volume of water being treated increases and its electrical conductivity rises (0.62→0.84) [See Figure 3 (b)]. Checking these cluster-specific trends at the plant found that, because flocculant dosage is comparatively lower when the volume of water being treated is low, the variability of turbidity rises under these conditions due to their being a minimum dosage quantity (meaning that adjustments smaller than this minimum are not possible). On the other hand, it is easier to maintain the target turbidity when treating a large amount of water because the change in treated water turbidity relative to the dosage quantity is smaller in this case, thereby making adjustment easier. This work demonstrated that cluster analysis can be used to classify trends in operational records of water quality control.
The next step was a regression analysis of each cluster obtained from the analysis of operational records and its use to develop a tool for calculating flocculant dosage so as to keep the water treatment plant operating at the target turbidity, with the clusters being assumed to correspond to different operating practices at the plant. The sequence of steps for the flocculant dosage calculation is as follows.
(1) Removal of invalid data in operational records, (2) Calculation and adjustment of flocculant dosing rate and sedimentation time, (3) Use of cluster analysis and regression analysis to estimate flocculant dosing rate for given target turbidity, and (4) Calculation of Euclidean distance from cluster mean.
The middle part of Figure 4 shows the results of the trial calculation of the flocculant dosing rate. The calculated values (dots) tend to be less than the dosing rate used in practice (solid line). As shown in the lower graph in Figure 4, using a threshold Euclidean distance of 0.8 to filter the estimation results provides a way to highlight and eliminate cases (a) to (c) where the estimation accuracy is clearly poor, or to advise caution in cases like (d) where the estimation accuracy is also low. In other words, it is possible to inform the operators about the accuracy of the estimations through the quantitative assessment of cases of poor accuracy, such as when there is a lack of historical data.
In the future, Hitachi intends to develop and deploy systems for collecting operational records from water treatment plants automatically, and to use this to support water treatment plant operation.
Figure 4 — Estimated Flocculant Dosage Rate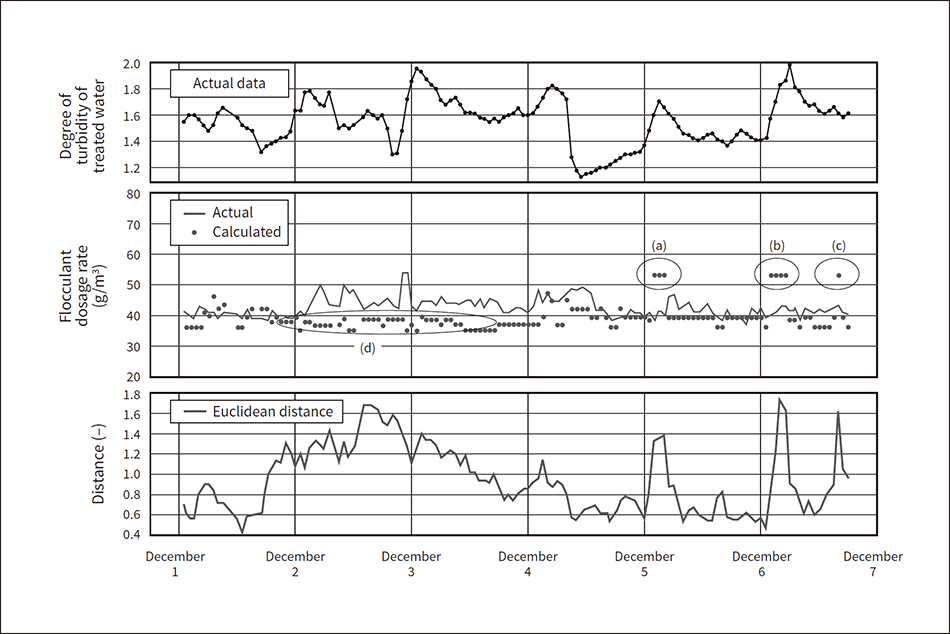 Flocculant dosage rates were estimated based on a learning data period of August 1 to November 30, 2017 and a test data period of December 1 to 6. The results of the method for using cluster analysis to estimate flocculant dosage rate based on a specified target turbidity indicated that the calculated values (dots) tended to be less than the dosage rate used in practice (solid line).
Seawater is used as a source of domestic water in regions like the Middle East where rainfall is low and in island nations that lack rivers and other sources of fresh water. Distillation systems were a common way to produce fresh water, but in recent years, the standard method uses reverse osmosis (RO) membranes because the systems are more compact and avoid the cost of the fuel needed for distillation. Many distillation systems installed in the past are being replaced with RO membrane desalination.
RO systems for seawater desalination produce fresh water and brine by using pumps to raise the pressure of seawater above its osmotic pressure. The volume ratio of fresh water to seawater is called the recovery rate, with RO systems for seawater desalination that use the conventional process achieving rates of 40 to 45%. If the recovery rate can be increased, the same size of RO system can produce more fresh water. On the other hand, in order to improve the recovery rate, it is necessary to increase the pressure of the high-pressure pump. However, in the conventional process, the flux (volume of water passing through the membrane per unit area per unit time) in the system becomes non-uniform and gives rise to the problem of flux exceeding the allowable value particularly in the lead element of the RO membrane. Exceeding the allowable value causes a heavy load on the membrane and increases the risk of the membrane fouling by organic or other matter.
Hitachi has developed a high-recovery seawater RO desalination system to overcome these problems (see Figure 5). An RO system is made up of high-pressure vessels that house multiple RO membrane elements. The system achieves a uniform flux through the RO membrane elements by splitting the elements across multiple stages rather than a single stage as in the conventional process. As the resistance of an energy recovery device (ERD) can be used to prevent exceeding flux in the lead element of RO membrane, the system can achieve a recovery rate of 60%. As the lead element of RO membranes are particularly prone to fouling, splitting the elements into multiple stages also reduces the risk of fouling by spreading the incoming foulant across more lead elements of RO membranes (see Figure 6).
Figure 5 — Structure of Membranes Used by High-recovery Seawater RO Desalination System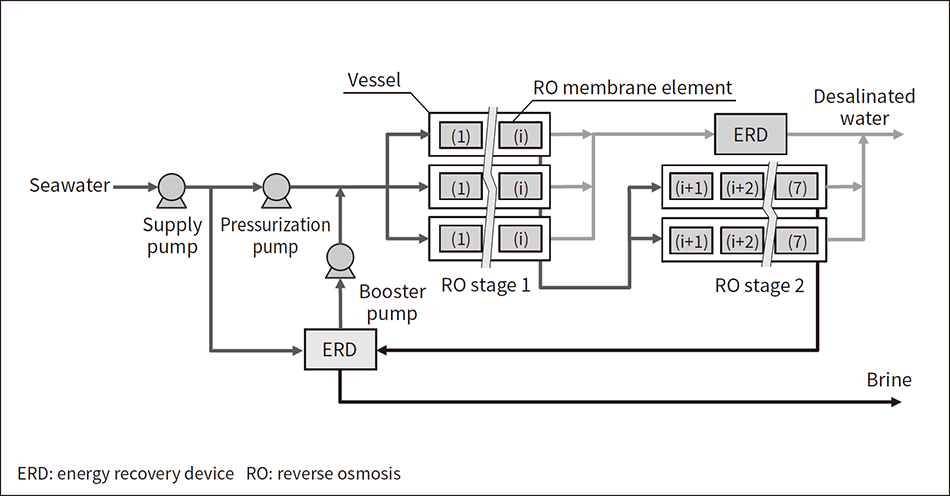 The system achieves a uniform flux through the RO membrane elements by splitting the elements across multiple stages rather than housing them in a single vessel stage as in the conventional process.
Figure 6 — Comparison of Membrane Fouling in Conventional Process and High-recovery Seawater RO Desalination System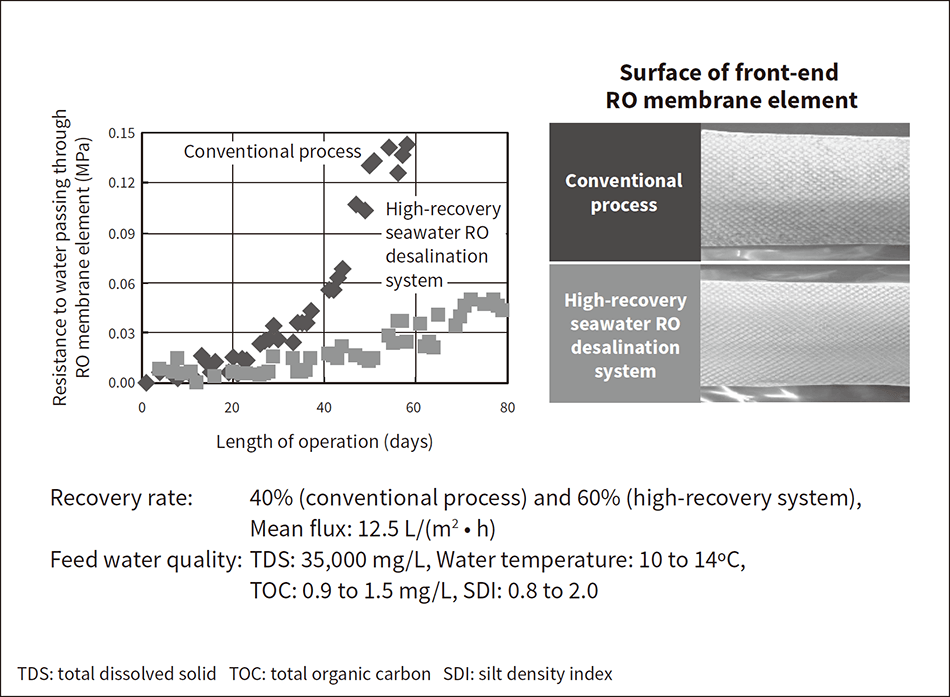 Splitting the elements into multiple stages reduces the risk of fouling by spreading the contaminant load across multiple front-end membranes (which are the ones most prone to fouling).
Figure 7 — Example Installation and Benefits of High-recovery Seawater Desalination System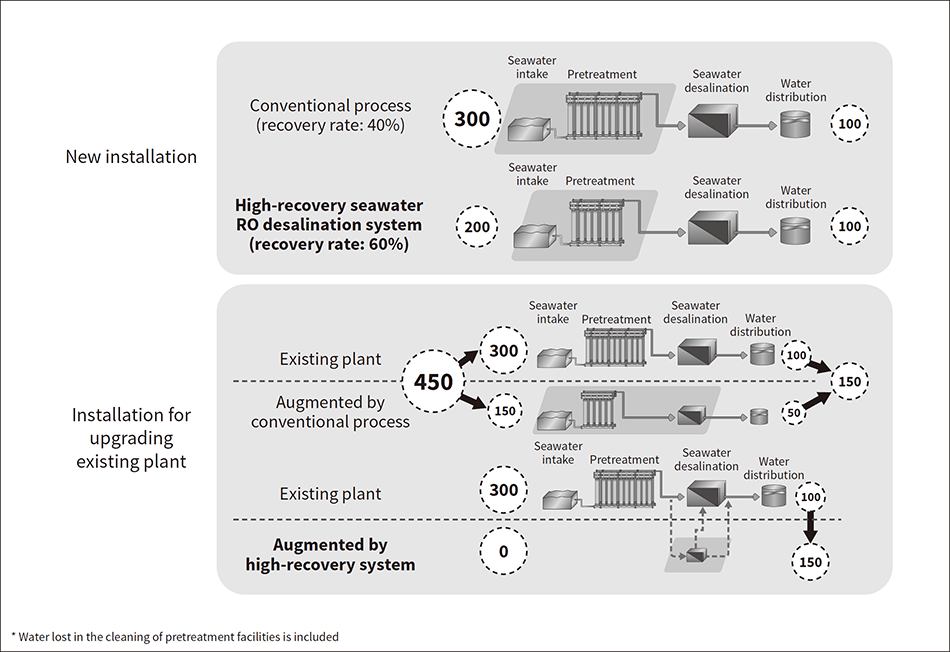 If the amount of water to be produced is defined as 100, the required intake of seawater is 300 when using the conventional process but only 200 when using the high-recovery seawater RO desalination system. Accordingly, a 33% reduction in the capacity of the intake and pretreatment facilities and a matching reduction in chemical usage can be anticipated if the high-recovery system is selected when building a new seawater desalination plant. When upgrading an existing plant, putting more water through the conventional process requires an expansion of pretreatment facilities to handle the higher seawater intake. If the high-recovery system is used instead, however, the amount of fresh water produced can be increased from 100 to 150 while leaving the seawater intake unchanged and continuing to use the existing intake and pretreatment facilities.
Hitachi is promoting seawater desalination business in Asia and in other regions with shortages of fresh water. As part of the Demonstration Project for Energy Saving Seawater RO System of the New Energy and Industrial Technology Development Organization (NEDO), which used technology developed by the Mega-ton Water System Project (FY2010 to FY2013) undertaken under the Cabinet Office’s Funding Program for World-Leading Innovative R&D on Science and Technology (FIRST Program), Hitachi is planning a large-scale demonstration project for producing 10,000 m3/day of water in the Kingdom of Saudi Arabia in collaboration with Toray Industries, Inc. and Saline Water Conversion Corporation (SWCC), a Saudi government-owned seawater desalination company.
Hitachi is working on the development of efficient and sustainable water supply solutions intended to address unavoidable problems such as water shortages and a lack of technical staff that have come about through difficult-to-control factors such as climate change and demographic shifts. The intention for the future is to continue contributing to the establishment of robust water infrastructure through the ongoing supply of solutions that combine information technology, product design technology, and equipment operating technology.
