Lithium-ion rechargeable batteries are being increasingly used as the power source for means of transportation such as electric vehicles, rolling stock, and airplanes. Since these applications require batteries that are high output, small, and long-lasting all at the same time, it is important to have technology for predicting battery degradation according to operating conditions. However, the degradation behavior of batteries is complex, and no prediction technique has become established yet. One reason for this is that multiple causes of degradation occur within the battery simultaneously. Typical examples of degradation in battery properties are capacity fading and increased internal resistance. Hitachi aims to develop highly accurate degradation prediction by understanding each cause of degradation individually and assessing the relationship between battery properties and the causes of degradation. This article introduces a method of non-destructive diagnosis that reduces the causes of capacity fading and increased internal resistance to a few parameters, and a degradation prediction technology based on the results of this diagnosis.


Lithium-ion rechargeable batteries (LIBs) have high energy density and are used as power sources for large means of transport such as electric vehicles (EVs), rolling stock, and airplanes. Property degradation is an extremely important issue for these applications. The secondary use of used batteries is also important to consider when trying to establish a circulatory society. As a result, there is an increasing need for technologies that can predict battery capacity and internal resistance.
The cathode and anode of an LIB have lithium storage sites and lithium ions move back and forth between them while the battery is charged or discharged. LIB capacity fading is caused by decreased cathode and anode capacity, and changes (capacity deviation) in the corresponding relationship between the cathode and anode potential. The causes of the increase in LIB internal resistance can be broadly divided into an increase in the resistance of the cathode and anode, and an increase in the resistance of the electrolyte and other materials. In this case, Hitachi developed a method of non-destructive diagnosis to isolate these causes and evaluate them quantitatively(1), (2). This diagnostic method makes it easy to accumulate data on changes in the causes of degradation over time. This characteristic of LIBs was also utilized to develop methods of predicting battery capacity and internal resistance based on the changes of each degradation cause.
Figure 1 shows an overview of battery degradation diagnosis. In this method, it was assumed that the relationship between the state of charge of the cathode and anode active materials and the open circuit potential and internal resistance is based on the unique relationship between the active materials, and does not change due to degradation. The state of charge of cathode and anode active materials is expressed as the discharged quantity of electricity qp, qn (Ah/g) per active material unit mass; the open circuit potential as Vp, Vn (V); and the internal resistance as the resistance rp, rn (Ωg) per active material unit mass. These were calibrated and combined appropriately to calculate the relationship between the quantity Q of electricity discharged by the battery, open circuit voltage V, and internal resistance R (Q-V curve, Q-R curve).
Figure 1 — Overview of Battery Degradation Diagnosis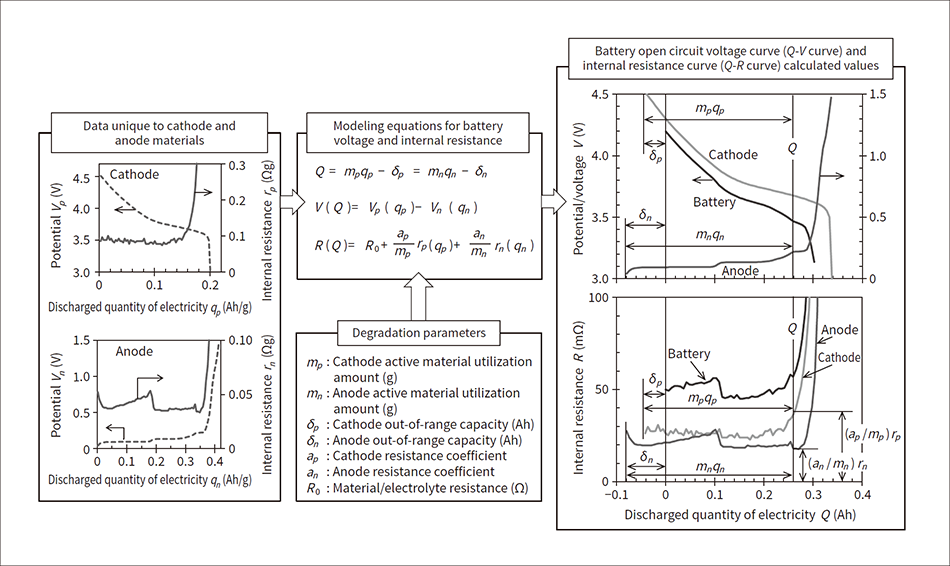 The data unique to the cathode and anode and the degradation parameters were substituted into the modeling equations for the battery voltage and internal resistance to calculate the battery open circuit voltage curve and internal resistance curve, which were compared to the actual measured values (not shown in figure). It was assumed that the data unique to the cathode and anode materials do not change according to degradation.
First, the concept of the Q-V curve analysis will be described. Open circuit voltage V is the difference between the open circuit potential Vp and Vn of the cathode and anode. If the cathode and anode active material amount that contributes to charging and discharging (active material utilization amount) are mp, mn (g) and the cathode and anode capacity with a state of charge higher than the battery fully charged state (Q=0) (out of range capacity) are δp, δn (Ah), then the relationship can be expressed as follows.
(1)Q=mpqp-δp=mnqn-δn
(2)V(Q)=Vp(qp)-Vn(qn)
The Q-V curve of the battery was calculated with Equation (1) and Equation (2). The state of degradation was diagnosed by adjusting parameters mp, mn, δp, and δn to fit the actual measured values of the battery Q-V curve to determine mp, mn, δp, and δn.
Next, the concept of the Q-R curve analysis will be described. The battery internal resistance R includes the resistance of materials such as the collector foil and tabs, the electrolyte resistance, the resistance of the cathode and anode electron conduction network, the charge transfer resistance, and lithium diffusion within the active materials. These can be divided into components that depend on the state of charge of the cathode and anode, and components that do not. The former are combined for each electrode and expressed as Rp(qp), Rn(qn), while the latter are all expressed together as R0. The internal resistance R(Q) of the battery at this time is expressed as follows.
(3)R(Q)=Rp(qp)+Rn(qn)+R0
Component Rp(qp), Rn(qn) dependent on the state of charge is comprised of the charge transfer resistance and lithium diffusion. Since these appear in inverse proportion to the reaction surface area, they are approximately in inverse proportion to mp and mn. Therefore, cathode and anode internal resistance rp, rn per active material unit mass were defined as the standard values for these resistance components. In addition, cathode and anode resistance coefficients ap, an were introduced as coefficients to express the effects of changes in the active material surface conditions due to battery degradation. Taking the factors above into consideration, the equation above was expressed again as follows.
(4)R(Q)=R0+(ap/mp)rp(qp)+(an/mn)rn(qn)
The Q-R curve of the battery was calculated with Equation (1) and Equation (4), and compared to the actual measured values. Values determined in the Q-V curve analysis were used for mp, mn, δp, δn, and R0, ap, an were set as fitting parameters.
Figure 2 — Unique Properties of Cathode and Anode Materials This shows the data unique to cathode and anode materials that were acquired from the intermittent discharge of a half-cell comprised of a cathode or anode and lithium metal. In the figure, (a) and (b) show the curve for the open circuit potential per cathode and anode active material unit mass, and (c) and (d) show the curve for the internal resistance per cathode and anode active material unit mass.
The following describes the method for measuring data unique to the cathode and anode. With the cathode and anode as the working electrodes, the half-cell with lithium metal as the counter electrode and reference electrode was fully charged, then discharged with one-hour rate current for 72 seconds and rested for 30 minutes. This operation was repeated until the prescribed voltage was reached. From the acquired voltage response, open circuit potential Vp, Vn relative to accumulated discharged quantity of electricity Qp, Qn, and the internal resistance after discharging for 1 second, 10 seconds, and 72 seconds (Rp,1, Rn,1, Rp,10, Rn,10, Rp,72, Rn,72) were extracted. Figure 2 shows the results of these values normalized with the cathode and anode active material mass. In Figure 2, (a) shows the qp-Vp curve, (b) shows the qn-Vn curve, (c) shows the qp-rp curve, and (d) shows the qn-rn curve. Considering that battery control needs to cover internal resistance across a wide range of discharge times, the internal resistance values were extracted for three different discharge times.
Figure 3 — Example of Q-V Curve and Q-R Curve Analysis for Battery in Initial State and after Degradation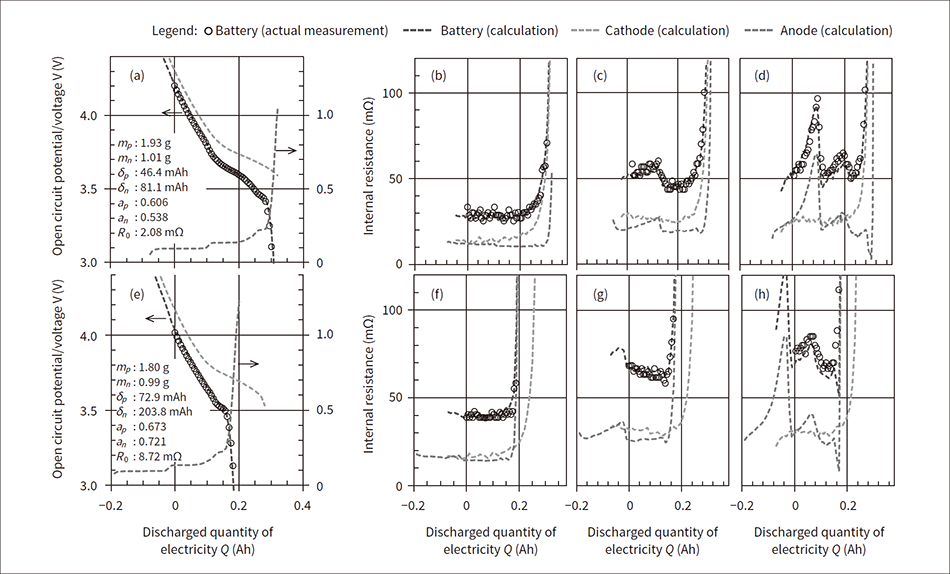 In the figure, (a) to (d) show the initial state, and (e) to (h) show the results of analysis after storing the battery at 50°C and 90% state of charge (SOC) for 1,020 days. Also, (a) and (e) show the open circuit voltage, (b) and (f) show the internal resistance after discharging for 1 second, (c) and (g) show the internal resistance after discharging for 10 seconds, and (d) and (h) show the internal resistance after discharging for 72 seconds.
The following describes battery life testing, and Q-V curve and Q-R curve measurement. A small, cylindrical prototype battery was made, and a storage test was performed under the following two conditions: (1) 25°C, 3.65 V (50% SOC) and (2) 50°C, 4.06 V (90% SOC). Here, state of charge (SOC) is the battery capacity expressed as a percentage, with the fully charge state expressed as 100% and the fully discharged state expressed as 0%. In the storage test, the battery was charged to the prescribed voltage, then it was stored in a constant-temperature chamber, and the Q-V curve and Q-R curve were measured at 25°C every 30 days. In the measurement, the battery was charged to 4.2 V (100% SOC), then discharged with one-hour rate current for 72 seconds (equivalent to 2% SOC), and then rested for 30 minutes. This operation was repeated until the voltage reached 2.6 V.
In fitting the extracted Q-V curve and Q-R curve, the degradation parameters were adjusted to minimize the sum of the square errors of the measured values and calculated values. Figure 3 shows the initial state battery and the results of the Q-V curve and Q-R curve analysis after the battery is stored at 50°C and 4.06 V for 1,020 days.
In Figure 3, (a) to (d) show the initial state, and (e) to (h) show the state after degradation. (a) and (e) show the Q-V curve, (b) and (f) show the Q-R1 curve, (c) and (g) show the Q-R10 curve, and (d) and (h) show the Q-R72 curve. The degradation parameter values are shown in the figure.
The analysis results show that the small changes in active material utilization amount mp, mn of the cathode and anode and are not the main causes of battery capacity fading. On the other hand, the changes in the out-of-range capacities δp, δn of the cathode and anode increased significantly. When (δn−δp) is compared to eliminate the increase at the start of discharge due to the low voltage, the initial state is 34.7 mAh and the state after degradation is 130.9 mAh, which is about the same change as the faded battery capacity. (δn−δp) changes due to deviation in the charged amount between the cathode and anode as the lithium released from the cathode during charging is partially deactivated in a side reaction and is not stored in the anode. It was understood that this side reaction is the main cause of capacity fading. On the other hand, the increase in the internal resistance was caused by the combined effects of the increase in the cathode and anode resistance coefficient ap, an, the increase in material and electrolyte resistance R0, and the decrease in the active material utilization amount mp, mn.
The following describes the procedure for a degradation prediction method that utilizes the degradation diagnosis results. First, the Q-V curve and Q-R curve measured periodically in calendar life testing were analyzed, and the degradation parameters 480 storage days before were used to make a regression function. Next, this function was extrapolated up to 1,020 days, and the battery Q-V curve and Q-R curve were constructed by substituting the acquired degradation parameters into Equation (1), Equation (2), and Equation (4). Finally, the battery capacity was calculated from the Q-V curve in the battery open circuit voltage range of 3.13 to 4.01 V, and the internal resistance when the battery open circuit voltage is 3.3 V, 3.7 V, and 4.0 V was calculated from the Q-R curve.
Figure 4 shows the degradation parameters acquired from the analysis of the battery life testing data where (a) is the cathode active material utilization amount mp, (b) is the anode active material utilization amount mn, (c) is the difference in the out of range capacity of the cathode and anode (δn−δp), (d) is the cathode resistance coefficient ap, (e) is the anode resistance coefficient an, and (f) is the material and electrolyte resistance R0. The vertical axis in (a), (b), (d), and (e) is the ratio relative to the initial state value, the vertical axis of (c) is the ratio relative to the initial state capacity, and the vertical axis in (f) is the ratio relative to the initial state internal resistance (after discharging for 10 seconds, 3.7 V). In the figure, the color-filled plotted values are the analysis values of the actual measured data up to 480 days, the white-filled plotted values are the analysis values from 480 days and later, and the solid line is the regression function calculated from the analysis values up to 480 days.
Figure 5 shows the prediction results for the battery capacity and internal resistance where (a) shows the battery capacity, (b) shows the internal resistance R10 after discharging for 10 seconds when the battery open circuit voltage is 3.3 V, (c) shows R10 when the voltage is 3.7 V, and (d) shows R10 when the voltage is 4.0 V. In the figure, the color-filled plotted values are the analysis values of the actual measured data 480 storage days before, the white-filled plotted values are the analysis values from 480 days and later, and the solid line is the prediction curve. The dashed line is a well-known prediction based on a function proportional to the square root of time. As shown in (b) to (d) of Figure 5, although the tendency of internal resistance to change over time varies according to the voltage, the prediction curves are able to approximately follow each behavior. However, note that as shown in (b), in the area near voltage of 3.3 V, the prediction error increases because of the sudden change in the battery open circuit voltage and internal resistance.
It was understood that this method can be used to predict complex changes over time in the battery properties from the changes over time in various degradation parameters. Future activities will attempt to further improve prediction accuracy.
Figure 4 — Trend of Degradation Parameters Acquired from Analysis of Battery Life Testing Data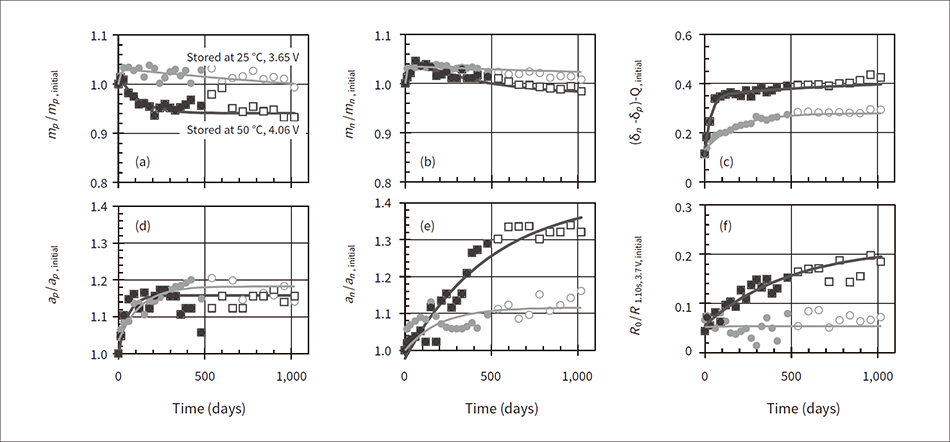 In the figure, (a) shows the cathode active material utilization amount, (b) shows the anode active material utilization amount, (c) shows the difference in the out-of-range capacity of the cathode and anode, (d) shows the cathode resistance coefficient, (e) shows the anode resistance coefficient, and (f) shows the material and electrolyte resistance. The vertical axes show the ratio relative to the initial state analysis value, capacity, or internal resistance (after discharging for 10 seconds, 3.7 V).
Figure 5 — Prediction Results for Battery Capacity and Internal Resistance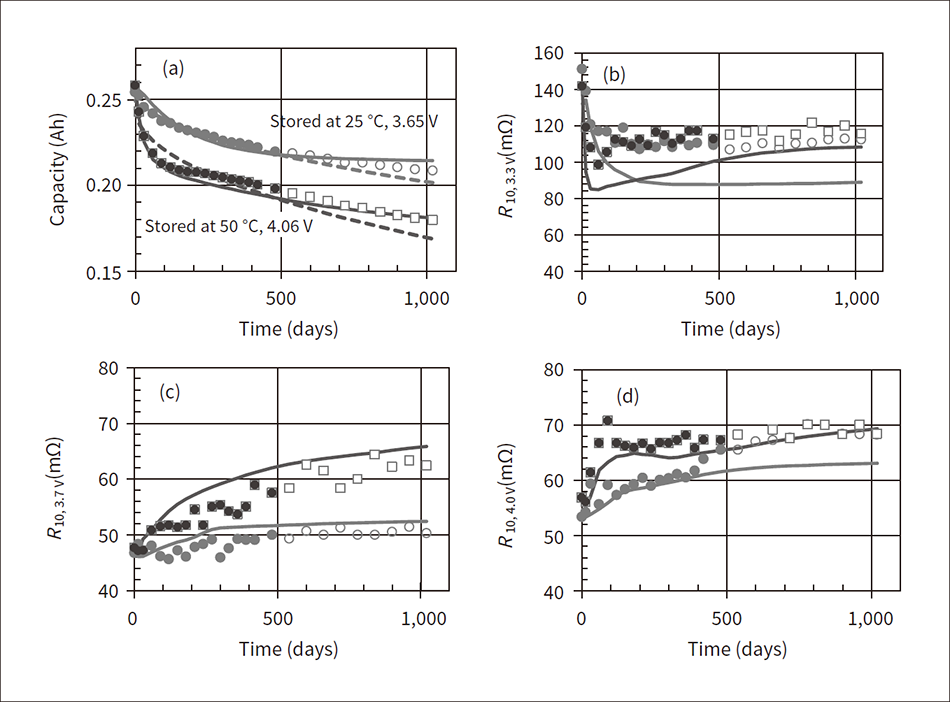 In the figure, (a) shows the prediction results for the battery capacity, (b) shows the prediction results for the internal resistance after discharging for 10 seconds when the battery open circuit voltage is 3.3 V, (c) shows the prediction results for the internal resistance after discharging for 10 seconds when the battery open circuit voltage is 3.7 V, and (d) shows the prediction results for the internal resistance after discharging for 10 seconds when the battery open circuit voltage is 4.0 V.
This article described a method of non-destructive diagnosis that can isolate the causes of LIB capacity fading and increased internal resistance, and degradation prediction methods based on the diagnosis results.
As mentioned at the beginning of the article, technologies for LIB state diagnosis and degradation prediction are required for the optimal operation of LIB in long-term applications, and for situations such as determining the residual value of the battery in a used EV. Such technologies are forecast to become ever more important in the future. The development of these technologies is expected to extend the life of LIBs and make secondary use more efficient, thus reducing the environmental impact of the batteries.
