The effects of aging and deterioration at petrochemical plants built in Japan during the period of rapid economic growth have become a major issue when trying to ensure stable operations, and in the operation and maintenance of equipment. Furthermore, aging plants require advanced maintenance in addition to conventional maintenance, making it essential to pass down the know-how of experienced maintenance staff and establish maintenance based on state monitoring to reduce costs and save labor. Hitachi has been pursing activities to address these issues since 2016, collecting data about the state of equipment and devices, and utilizing IoT and AI technologies, with the aim of achieving stable plant operations. This article describes predictive diagnosis techniques that use data retrieved from equipment and devices to help resolve issues in achieving stable operations at plants in Japan, as well as a related case study.


Industrial and energy-related infrastructure in Japan, such as petrochemical, electricity, and gas plants, face a wide range of structural and societal issues. These include aging of equipment, aging and long-term shortages of human resources, and a decline in the ability to pass on technologies and technical skills. To address these issues, many companies in the industry are attempting to further improve industrial maintenance capabilities and productivity through actions such as introducing new techniques to increase safety and technologies to complement human work.
In Japan, the government launched its Society 5.0 vision for realizing a super-smart society in January 2016, encouraging the development of a society based on the latest technologies such as the Internet of Things (IoT). Specific visions of the future have been released and action plans created, but now the critical time for taking action is approaching.
Hitachi High-Tech Solutions Corporation has been testing and verifying anomaly diagnosis techniques using equipment data and process data since 2016. In particular, there have been many examples of sudden failures due to deterioration at petrochemical plants which, while not causing major accidents in terms of injuries, have resulted in losses of hundreds of millions or billions of yen. The company also came to understand that the data were stored when an accident occurs, and an environment was ready for verification based on the theme of stabilizing operations.
This article uses a case study to describe the application of predictive diagnosis techniques at plants that contain a large number of variables, such as external disturbances and product volume, which were previously difficult to apply. The techniques introduced in this article are expected to contribute not only to the stabilization of operations at plants in Japan, but also to the optimization of maintenance planning, countermeasures for issues such as labor shortages, and the improvement of operational efficiency.
Figure 1 — BD-CUBE System Configuration and Data Flow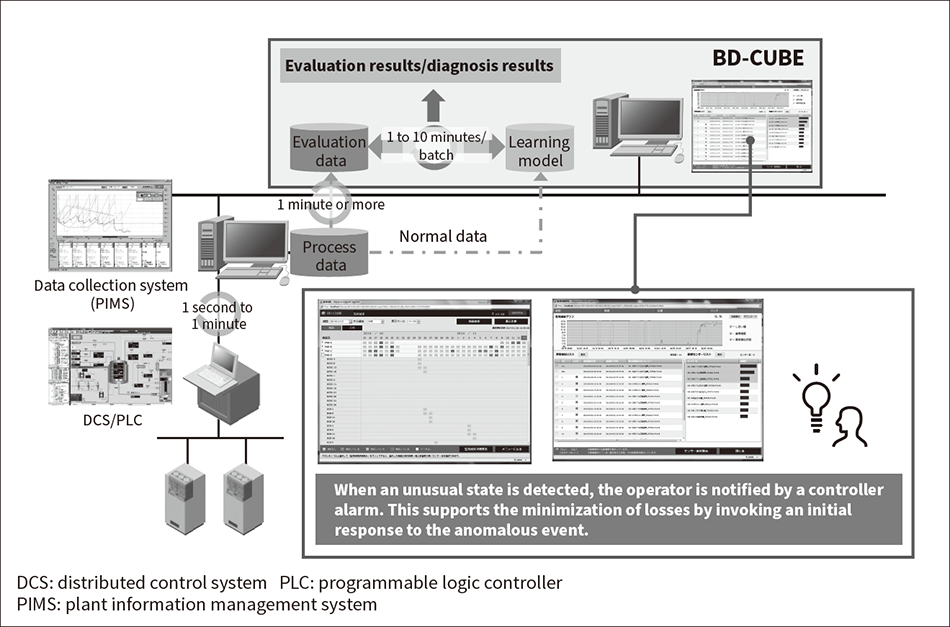 BD-CUBE collects and analyzes process data such as process values, control output values, and control setting values via a data collection system, enabling the early detection of variation in product quality, and anomalous states that result from the aging of plants and equipment.
The BD-CUBE predictive diagnostics system (an abbreviation of “big data - diagnosis, detection, and description”) is a system for diagnosing anomalous states* in equipment and product quality based on data collected from a distributed control system (DCS).
Figure 1 shows the BD-CUBE system configuration and data flow. BD-CUBE collects, stores, and analyzes data from control devices via a data collection system. Note that the plant information management system (PIMS) shown in Figure 1 is a data collection system developed by Hitachi High-Tech Solutions, which is able to collect data from DCSs and programmable logic controllers (PLCs) made by other companies via an object linking and embedding for process control (OPC) server, as well as data from monitoring and control systems. BD-CUBE collects and analyzes process data such as process values, control output values, and control setting values via this data collection system, enabling the early detection of variation in product quality, and anomalous states that result from the aging of plants and equipment. Detecting signs of anomalies in advance will enable countermeasures to be taken before product anomalies or equipment failures occur, which should reduce the attendant risks.
BD-CUBE features an analysis function that enables the early and accurate detection of product quality and equipment anomalies, and an impact factor ranking display function that can prompt rapid action from the operator when an anomaly occurs.
Figure 2 — Technique for Filtering Sensors Impacted by Anomaly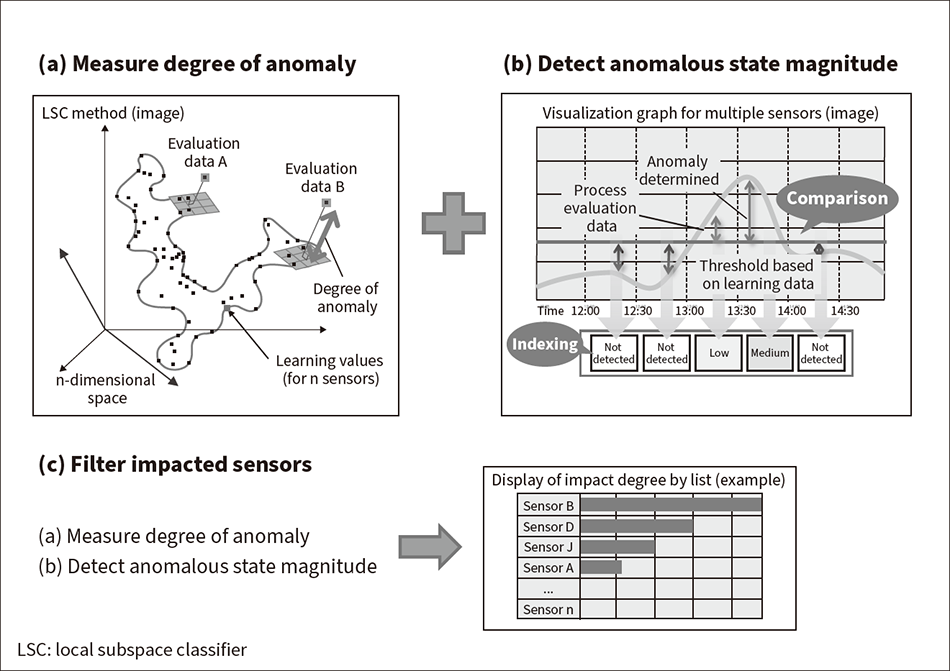 In filtering for impacted sensors, a round robin evaluation is performed of the correlation between each sensor, and the sensors are sorted in order from the one with the highest degree of anomaly. This enables filtering by prioritizing the sensors related to the anomalous state.
The BD-CUBE analysis function identifies behavior that is different from normal, evaluating the total value of anomaly measurements from all sensors during the period when the signs of an anomaly occur. This enables anomalies to be detected at an early stage without missing even the slightest changes.
Anomaly measurements express the degree of separation (degree of anomaly) between the correlated distribution density and the data to be evaluated. The larger the degree of separation, the greater the possibility of an anomaly being present. Figure 2 [(b) Detect anomalous state magnitude] shows a trend graph for the total value of the anomaly measurements from all sensors. The learning data and evaluation data are compared on the graph, and their separation is defined as an anomaly index that is used for an overall evaluation of the sensors. In Figure 2 [(c) Filter impacted sensors], a round robin evaluation is performed of the correlation between each sensor, and the sensors are sorted in order from the one with the highest degree of impact from the anomaly. This enables filtering by prioritizing the sensors related to the anomalous state. The identification of the related sensors is described in detail in section 2.4.
Figure 3 — Characteristics of LSC Method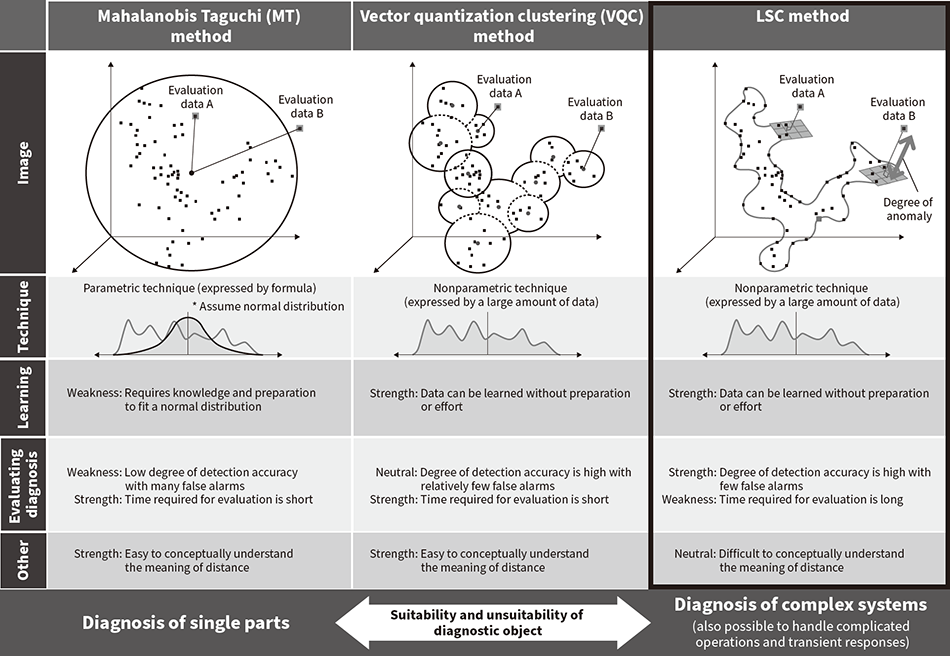 Compared to the MT and VQC methods, the LSC method makes it easier to create normal models for processes with complex operations and transient responses, enabling state detection with high detection accuracy.
BD-CUBE can detect signs of anomalies in processes at an early stage because it can identify the impacted sensors by taking co-occurrence into account. Co-occurrence means the simultaneously linked behavior of multiple sensors, such as temperature and pressure sensors, which is triggered by a single event.
BD-CUBE is equipped with the fast local subspace classifier (FLSC) method, which is based on the local subspace classifier (LSC) method and design to speed up the process. This proprietary Hitachi technique is an analysis method suitable for complex plant systems.
Figure 3 shows the characteristics of the LSC method, comparing it to other multivariate analysis types of pattern recognition techniques: the Mahalanobis Taguchi (MT) system and vector quantization clustering (VQC).
Compared to the MT and VQC methods, the LSC method makes it easier to create normal models for processes with complex operations and transient responses, enabling state detection with high detection accuracy. Therefore, compared to other analysis methods, this analysis method is highly evaluated as more suitable for complex systems. Furthermore, evaluations have shown that the LSC method results in a lower rate of incorrect detections due to its principle of creating a localized space when creating a learning model.
Taking this into account, Hitachi performed a test comparing the loads when creating normal models for the LSC method and the MT method by using known anomalous events from batch-processing plants. The results of this test showed that the number of man-hours required to create a normal model under the LSC method was 1/3 to 1/24 the number of man-hours required under the MT method. These results demonstrated that the LSC analysis method can also reduce the workload of normal model additions or revisions that occur when manufactured items are added, or process functions are added or improved.
Figure 4 — Identification of Related Sensors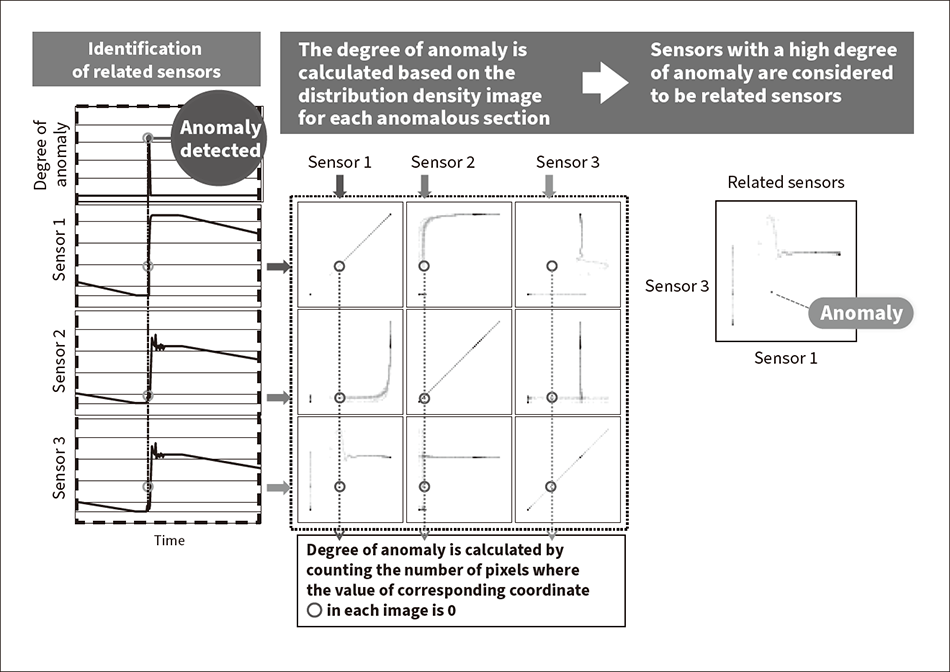 The related sensors are identified by plotting the correlation between all of the sensors in the learning data and evaluation data as a scatter diagram, and then calculating the total value for the distance of separation (degree of anomaly) from the scatter diagram of the learning data for each sensor.
As the first step in prompting the operator to take action after an anomaly is detected, BD-CUBE displays a ranking of the sensors that are most impacted by the anomaly [see Figure 2 (c)]. Image recognition technology is used to identify the related sensors. The correlation between all the sensors in the learning data is plotted as a scatter diagram, and then the evaluation data is also plotted in the same way along each timeline. At this point, the total value for the distance of separation (degree of anomaly) from the scatter diagram of the learning data is calculated for each sensor (see Figure 4).
By performing this in a round robin manner for all the sensors, the sensors that are behaving differently from the correct behavior of all sensors (the odd ones out) can be identified in the results.
Hitachi High-Tech Solutions proposed a proof of concept (PoC) to a user who was considering the deployment of BD-CUBE, and verified the effects of BD-CUBE in its own environment. The following presents a case study of anomaly detection for equipment failure based on this PoC.
The manufacturer for which this PoC was conducted faced the issue of aging utility equipment, and in the past had experienced a partial stop of its manufacturing process due to deterioration, requiring post-facto maintenance. The results of an inquiry into the failure showed that it was caused by damaged parts. The manufacturer realized that opportunity loss occurred due to its failure to predict the failure, and that it made a significant effort to identify the cause once the failure happened. Therefore, the company was studying the deployment of preventive monitoring based on BD-CUBE in order to achieve preventive maintenance. The two main themes of their evaluation were as follows.
The analysis was conducted offline in Hitachi High-Tech Solutions’ environment, based on the data stored in the utility equipment. Data was extracted for 10 sensor types related to the failure, such as temperature, flow rate, and pressure, and data for each minute was compiled in comma-separated values (CSV) format. Among these, data for 15 days of normal operation were learned, and evaluation data for the 15 days before the failure were analyzed. The analysis checked whether signs of the failure could be detected before the date on which the failure actually occurred, and the most impacted sensors were identified.
Figure 5 shows the results of offline verification using BD-CUBE. BD-CUBE detected an anomaly about 10 days before the date of the actual failure and captured a different state a total of 14 times. A customer evaluation showed that behavior 5 days before the failure (detected a different state a total of 5 times, detection rate 100%, anomaly probability rate 35.7%) was related to the failure. At this time, the most impacted sensor was for discharge pressure. The state 10 days before was a period when a different production load was captured and was not related to the failure. At this time, the most impacted sensor was for entrance temperature.
These verification results showed that over-detection due to differences in production volume could be reduced through additional learning, and that the most impactful sensor during the detection period related to the failure could be used to estimate the failure location. Therefore, the customer determined that deployment would be effective, and currently the system is operating in their online environment.
Figure 5 — Graph of Monitoring Results at Anomaly Detection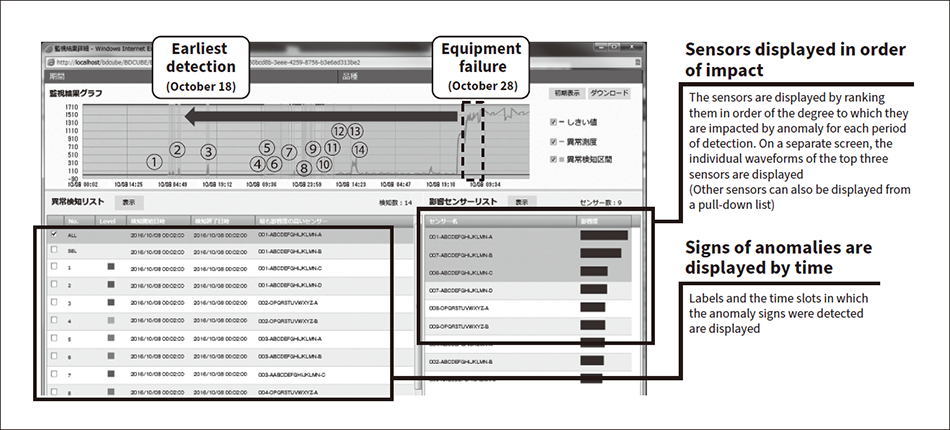 An anomaly was detected in the equipment 10 days before October 28, the date of the actual failure. The cause of the anomaly can be identified by displaying the sensors ranked by the degree to which they are impacted by the anomaly.
This article described predictive diagnosis techniques that will contribute to improved stability of plant operations. By applying BD-CUBE to plants that exhibit complex behavior, it was possible to detect and visualize states that were previously difficult for systems or humans to notice. However, two issues remain in preprocessing and postprocessing that are barriers to practical use. The issue in preprocessing is the systematization of learning-model construction (selecting the necessary sensors and indexing the appropriate data amount and quality). The issues in postprocessing are the accuracy of the anomaly detection alarms, and the presentation of information that links causes and countermeasures when an anomaly is detected.
In the future, Hitachi will verify the development of preprocessing and postprocessing techniques together with customers to provide a system that can be handled by operators themselves on site, thus further improving industrial maintenance capabilities and productivity.
