Manufacturing Solutions to Support End-to-End Optimization of the Value Chain
Hitachi’s Omika Works has provided many different control systems that underpin social infrastructure. Omika Works has developed a factory simulator that enables systemwide optimization from production to management. It works by linking 3M information and various other data visualized at the manufacturing site to automatically generate production plans that optimize the entire site over the medium and long terms.

IoT Systems Engineering Department, Control System Platform Division, Services & Platforms Business Unit, Hitachi, Ltd. Current work and research: System development and engineering of production planning optimization solutions.

Production Management Department, Control System Platform Division, Services & Platforms Business Unit, Hitachi, Ltd. Current work and research: Production management of control system products of Omika Works.

Production & Information Systems Engineering Department, Control System Platform Division, Services & Platforms Business Unit, Hitachi, Ltd. Current work and research: System development and operation of production management systems of Omika Works.

Production Systems Research Department, Center for Technology Innovation –Production Engineering, Research & Development Group, Hitachi, Ltd. Current work and research: Research and development of production management systems.
Since it opened in 1969, Hitachi’s Omika Works has built infrastructure systems in collaboration with customers representing a diverse range of industries such as power, public transport, steel, and public utilities. Creating strong relationships with these customers has required ongoing advances in made-to-order manufacturing to produce products meeting finely tuned customer needs. Omika Works is called on to create control systems with different system configurations and component configurations, designed for use by different customers in different industries. The characteristics needed to meet these demands are (1) high-mix low-volume production, and (2) a wide range of different manufacturing lines. By drawing on these characteristics, using digital data, and systematizing and reorganizing its existing data, Omika Works now wants to transform itself from a made-to-order manufacturer into a manufacturer of ready-made products that anticipate customers’ needs.
For the past 20 years, Omika Works has worked on several improvements in areas such as design, information technology (IT), and manufacturing. But since each of these improvements has been approached separately, each has suffered from the problem of being individually optimized. Solving this problem requires Internet of Things (IoT)-driven production reforms using various types of digital data, along with work on systemwide optimization using top-down approaches in addition to the bottom-up approaches previously used. Omika Works has responded by working on creating a high-efficiency production model designed to provide systemwide optimization by using the IoT to connect a wide range of production improvement. The aim is top-down cost structure reform designed to make Omika Works globally competitive as part of the Hitachi Smart Transformation Project (a Hitachi Group structural reform initiative).
Omika Works has accumulated a large amount of data from business activities ranging from preliminary studies to investment, design, manufacturing, and maintenance. The various types of data were previously stored in a separate system in a state of individual optimization. Accordingly, Omika Works wants to optimize the entire plant using a conceptual model called the sense, think, act cycle which involves visualizing data (“sense”), analyzing the data (“think”), and then responding (“act”) based on the acquired knowledge. This conceptual model has been used to construct a high-efficiency production model. Specifically, the IoT is used to collect various data generated through business activities, the data are analyzed to generate possible responses to issues, and then the results are rapidly fed back to the site. Figure 1 shows the basic functions of the constructed high-efficiency production model(1).
Figure 1—Basic Functions of the High-efficiency Production Model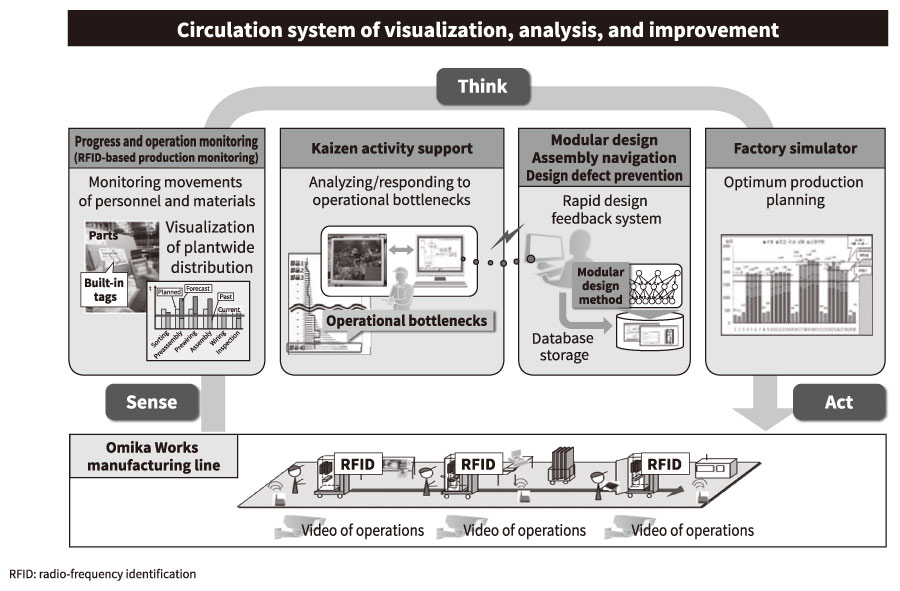 The high-efficiency production model is composed of a progress and operation monitoring (POM) system (RFID-based production monitoring), Kaizen activity support system, modular design/assembly navigation/design defect prevention (MOD) system, and the factory simulator. The POM system monitors the movements of personnel and materials. The Kaizen activity support system helps analyze and respond to operational bottlenecks. The MOD system rapidly provides design feedback and instructions in response to site problems. The factory simulator generates production plans for plantwide optimization.
Figure 2—Production System Maturity Model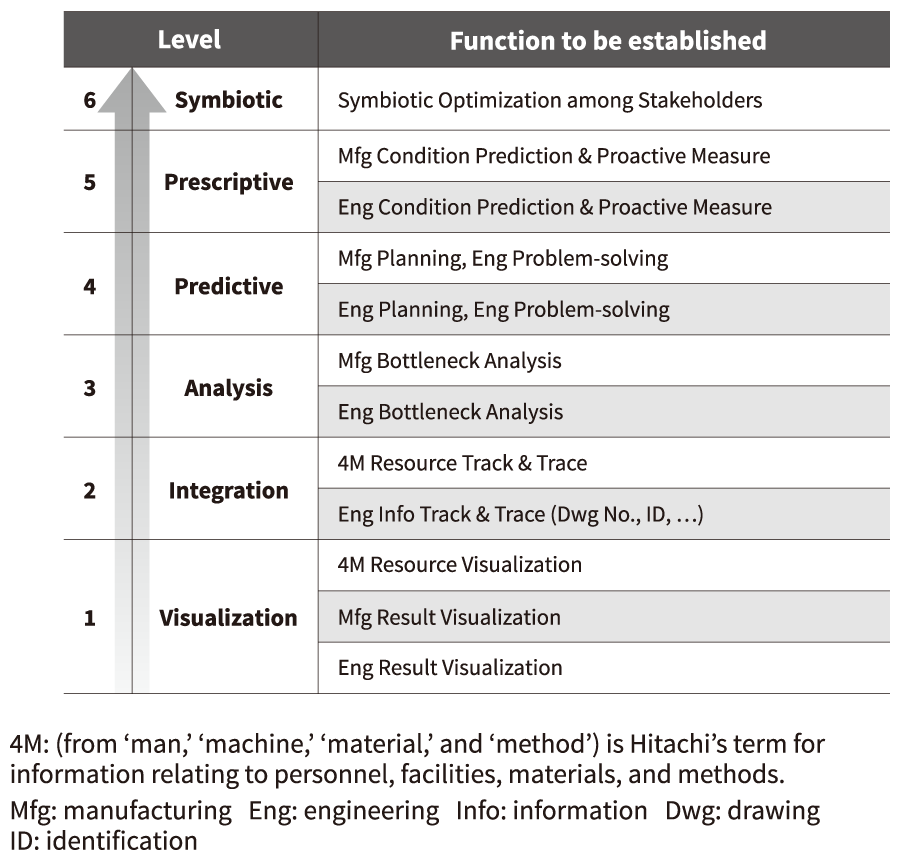 Hitachi has defined a production maturity model to achieve the vision set forth in a white paper from the International Electrotechnical Commission (IEC) entitled Factory of the Future, which calls for symbiotic ecosystems as the future of manufacturing.
Factory of the Future(2) is a white paper released by the International Electrotechnical Commission (IEC) that calls for symbiotic ecosystems. To enable the constructed high-efficiency production model to provide these types of ecosystems, Hitachi has analyzed the model’s current state by defining a production system maturity model. Figure 2 shows the maturity model(3).
Evaluating previous production systems under the standards of the maturity model has revealed that some systems have achieved high individual maturity levels, but the mechanisms for visualizing data, connecting them, and identifying problems are inadequate and exhibit only individual optimization. The high-efficiency production model therefore attempts to improve production in line with the standards of the maturity model. The model presents visualizations and connects plantwide 3M* information related to production capacities and loads (Levels 1 and 2 of the maturity model), controls flows (Level 3), clearly identifies bottleneck operations and designs (Level 4), and optimizes plantwide production plans (Level 5). Among the basic functions of the high-efficiency production model shown in Figure 1, the factory simulator corresponds to Level 5 of the maturity model shown in Figure 2. It connects various individual elements to support systemwide optimization from production to management.
Figure 3 provides an overview of the production processes and production planning work needed for control systems.
Control system design processes consist of designing hardware such as devices and parts, and designing the software needed to operate the controlled devices. The products are then assembled and wired after procuring parts, manufacturing printed circuit boards (PCB), and manufacturing the chassis. After that, the products are tested, shipped, and installed at the customer’s site.
Depending on the project scale, these products can take months or years to complete, creating a lot of variation in the production lead time (LT). Various types and quantities of product components such as PCBs and chassis are also used for each project, creating variation in the time needed for the work (standard time, ST), and the time needed for machining (machine time, MT). To set deadlines and daily input work quantities for the design, manufacturing, and testing processes, Omika Works would therefore estimate the basic unit (value needed to produce one product) for LT, ST, and MT when planning production.
Figure 3—Overview of Control System Production Processes and Production Planning Work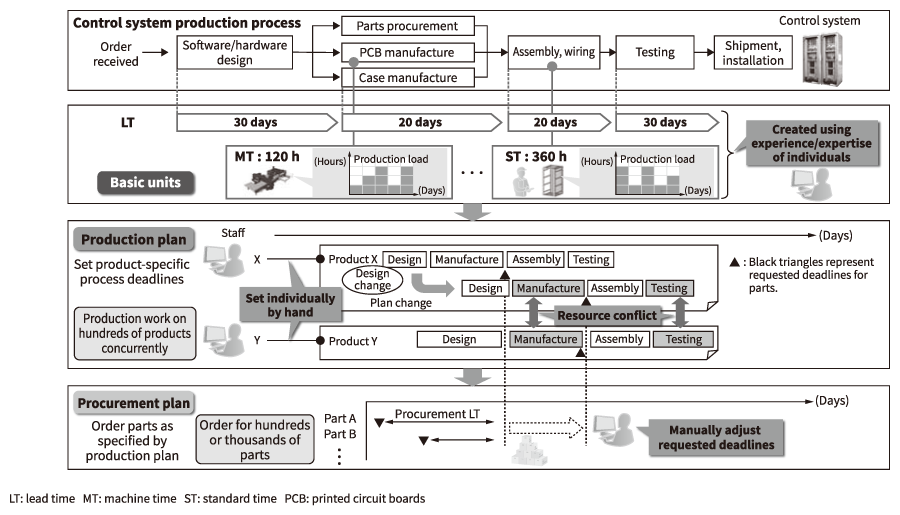 Omika Works produces control systems using separate procedures for order-taking, design, and production work. For each project, the design, manufacturing, and testing processes are tailored to the customer’s specifications. The staff assigned to each product estimate basic units for various values (such as LT, ST, and MT), set deadlines for each process, and order parts.
The three issues below were tackled for the production planning work described in the previous section.
To overcome these challenges and enable production planning designed for plantwide optimization, Omika Works digitalized and developed visualizations of the old production planning methods that used to rely on the experience and expertise of each individual. A system was developed to create optimum production plans and parts procurement plans by using actual data collected from locations such as production sites. Table 1 shows the solutions created for the three issues listed above.
The next section describes the development methods and application methods focusing on the factory simulator that was developed to overcome the second challenge (2).
Table 1—Solutions for Production Planning Work Issues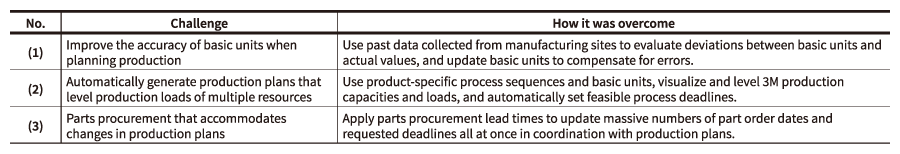 To enable the generation of production plans designed for plantwide optimization, Omika Works has developed a system that uses past data collected from production sites to generate optimum production plans and parts procurement plans.
As described in section 3.1, Omika Works produces control systems through projects that start when an order is received from a customer and extend to the delivery/installation phase. To create an automatic production planning function to overcome the second challenge (2) of section 3.2, Omika Works used a planning method based on the program evaluation and review technique (PERT), a project schedule planning method(4). For each process, this method considers the processing quantity per unit time (basic unit) to be a resource limitation, and creates plans that level production loads by piling and leveling them. Factory simulator functions with the characteristics shown in panel (a) and panel (b) of Figure 4 were developed(5) to handle major product variations and changes in daily production progress.
Figure 4—Features of Production Planning Function in Factory simulator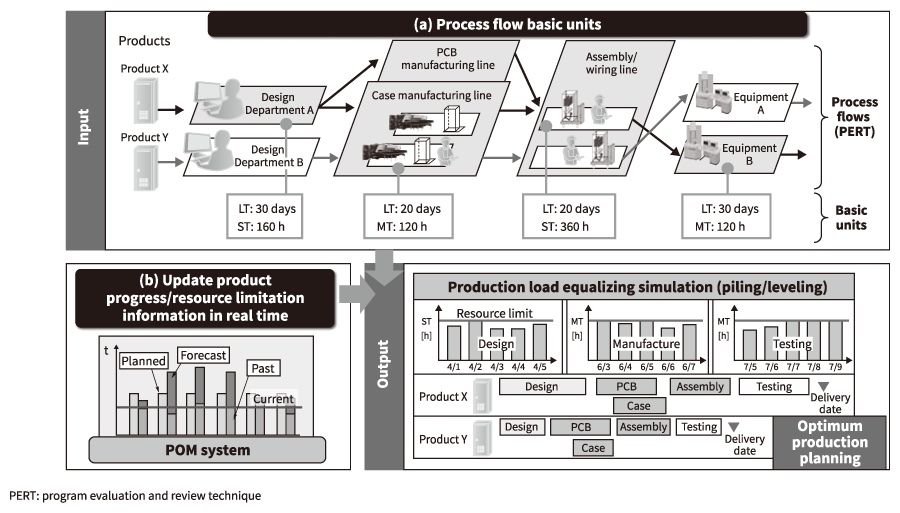 The factory simulator uses a project-based schedule planning method inspired by PERT, and has the following characteristics: (a) It defines product-specific process flow-basic unit combinations (process flow basic units), and uses them to handle production variations. (b) It updates production progress/resource limitation information in real time.
Figure 5 illustrates how the overall system is used at Omika Works. The system is composed of the factory simulator described in the last section, which is connected to the POM system and enterprise resource planning (ERP) software used within the plant. The procedure for using the system to plan production is as follows:
The procedure above was used to establish a circulation model of the sense, think, and act cycle in which the plantwide basic units and production progress are visualized (sense), the production load bottlenecks are identified and production plans (think) that level them are generated, and production instructions are issued (act) to the manufacturing site and parts are ordered. This model has enabled Omika Works to rapidly generate production plans and automatically change requested part deadlines even when process variations arise due to site problems or changes in customer delivery dates or design specifications. The model has helped optimize plantwide production plans, shorten lead times, and reduce inventory.
Figure 5—Factory simulator Application Method A circulation model of the sense (visualize data), think (analyze the data), and act (respond) cycle was created by connecting the factory simulator, POM system, and the plant’s ERP software. The model has helped optimize plantwide production planning and decrease inventories of resources such as parts.
Progressive implementation of the system composed of the factory simulator and Omika Works’ high-efficiency production model began in July 2017. The system is being used to assist problem-solving in the same manufacturing industry sectors that Hitachi works in(6), (7). Production improvements will continue at Omika Works to refine the system and provide it as one of the solution cores of Hitachi’s Lumada IoT platform. Refining the system will enable better end-to-end optimization of supply chains and engineering chains, from upstream to downstream.
