Digital biomarkers are objective indicators of a person’s mental and physical condition obtained by measuring their physiological or behavioral characteristics. In fields like health promotion and the prevention and treatment of disease, the use of these indicators in people’s daily lives is a useful tool for improving QoL through appropriate interventions or by encouraging behavioral change. After first classifying the different digital biomarkers from the perspective of sensing techniques and showing recent trend, this article presents examples of where digital biomarkers that have been the subject of research and development by Hitachi are used in health promotion or in care and disease prevention.


Digital biomarkers (DBMs) are objective indicators of a person’s mental and physical condition based on physiological or behavioral characteristics. They have attracted attention in recent years because of the growing importance, in the fields of health promotion and the prevention and treatment of disease, of practices for improving people’s quality of life (QoL) that involve recording physiological data on a daily basis to facilitate appropriate treatments or other interventions.
The health information collected for DBMs include both physiological and behavioral indicators. Among the former are heart rate, pulse, blood pressure, electrocardiograms (ECGs), electrodermal activity, and blood sugar levels. The latter are determined by measuring things like walking, bodily movements, speech, and eye movement. Opportunities for using these indicators in health promotion include health management, driving safety, workplace safety, and sporting performance. In care prevention (preventing the need for people to receive nursing care) and the prevention and treatment of disease, potential uses include early detection and preventing the onset or aggravation of disease, digital therapeutics, digital clinical trials, and online consultations.
The sensing techniques used for DBMs come in many different forms (see Table 1). They can be divided into non-invasive techniques, including ambient sensing and sensing techniques that are portable, app-based, wearable, or make use of augmented reality (AR) or virtual reality (VR), and invasive techniques that are implanted or ingested.
Ambient sensing may be based on electrical appliances and work by detecting their frequency of use, or may be installed in living spaces, such as in a wall, bed, or toilet, to assess things like bodily movement, vital signs, and the condition of excretions. Portable sensors include breath alcohol meters and non-invasive blood sugar meters that work by means of a mid-infrared laser. Examples of app-based sensing, there are many of them, might include the use of a smartphone or PC camera to assess motor function or mental health. Wearable sensors include smartwatches and other wristband sensors as well as those that form part of rings, glasses, badges, or clothing. In addition to bodily movements, these wearable sensors can measure things like heart rate, ECGs, electrodermal activity, and respiration. Uses of AR or VR in sensing include assessing vision and brain function by recording an electroencephalogram (EEG) or measuring movements while the user is presented with visual information in a virtual space.
Invasive sensing techniques can be implanted or ingested. An example of the latter is the oral ingestion of a sensor to record internal body temperature or whether medication is being taken. Implanted sensors can be used to measure blood sugar, either by placing them under the skin or incorporating them into contact lenses.
While these implanted or ingested sensors can measure what is happening inside the body, their invasive nature places a heavy burden on the patient and safety considerations discourage their widespread use. Non-invasive sensors, on the other hand, do not place much stress on the patient so are suited to a wide range of uses despite their being limited to measurements made by non-contact means or through the skin.
Accordingly, the Research & Development Group of Hitachi, Ltd. has been working to develop DBMs that can be obtained from ambient, portable, app-based, or wearable sensors, focusing on their use in a wide range of applications involving health promotion or care and disease prevention. This article describes these various DBMs and the plans for the future.
Table 1 — Example DBMs and Sensing Techniques Used The table lists example digital biomarkers (DBMs), classifying them along with their example use: ambient, portable, app-based, wearable, AR or VR, ingestible, or implanted sensors (in order of low invasiveness).
This section describes DBMs developed by Hitachi for health promotion. Section 2.1 is about an ambient and app-based DBM for assessing and improving body functions aimed at improving worker health. Section 2.2 and 2.3 are about wearable-type DBMs and describe a sports team analysis technique for improving group performance and operational safety in the transportation industry that reduces driver accident risk, respectively.
Figure 1 — Assessment of Overhead Squat as Part of Posture Assessment and Improvement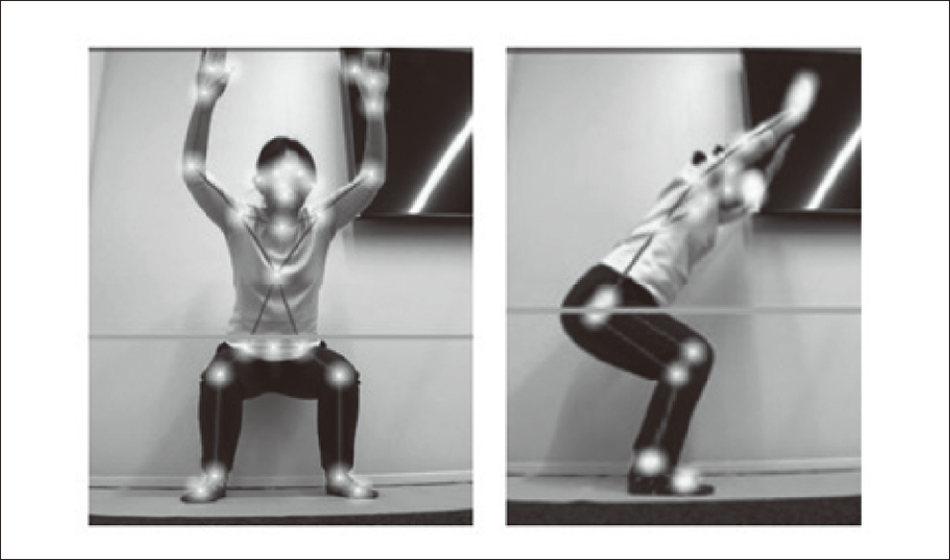 Hitachi has developed a system for identifying over- or under-exertion of specific muscles and offering timely programs for improving flexibility and strength. The system determines 17 musculoskeletal parameters when the user adopts this pose.
Interest in health management practices has grown in recent years as a means of maintaining and improving the health of workers so that they continue to work productively. The challenge here is to find ways of encouraging behavioral changes in workers that will maintain and improve their health. To achieve this, Hitachi has developed simple DBMs for quantifying body functions together with ways of using these DBM assessments as a basis for improving those functions. The following section describes two techniques for evaluating and improving static and dynamic body functions, respectively.
In addition to health management, the two DBMs described in (1) and (2) also have potential for use in the prevention of symptomatic and pre-symptomatic illness in daily life, support for health maintenance and improvement, the assessment of people recovering from illness, and mental and physical health monitoring for people living with a disease.
Figure 2 — Exercise Support and Assessment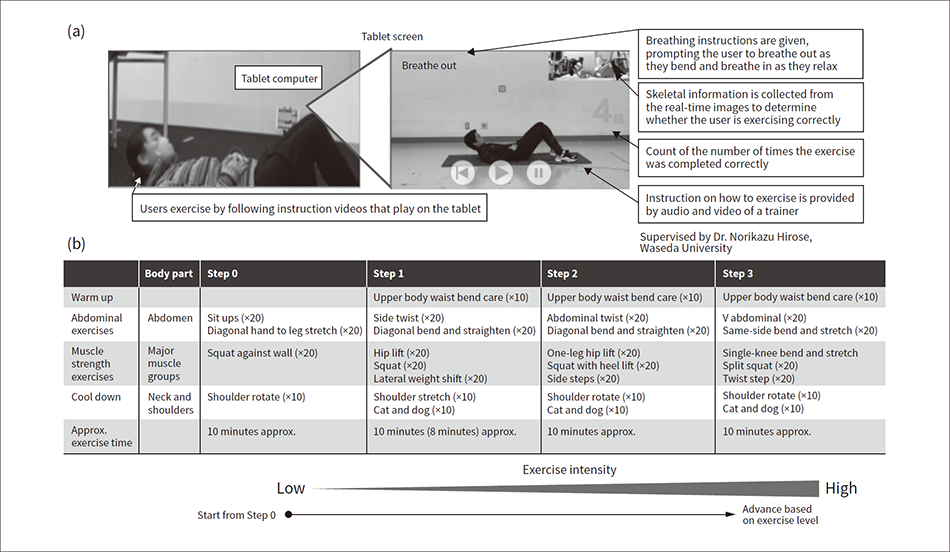 The figure at the top (a) shows how the exercise app is used on a tablet computer. The table (b) lists the exercise options available in the app. Users can work their way up through levels of exercise intensity from Step 0 to Step 3.
Sport has come to recognize the potential coaching benefits of quantitative and objective assessments of athlete performance that are based on the analysis of data collected from sensors. While greater use is now being made of individual performance indicators such as exercise intensity and speed, there has been a lack of effective techniques such as video analysis for considering the equally important issue of group performance that looks at the interrelationships between the movements of multiple players. The problem has been that it is difficult for a coach in the field to gain an objective assessment of how the players in a team interact in their movements so that this can be used to provide effective coaching.
In response, Hitachi has devised an analysis technique that uses transfer entropy as an estimate of latent information transfer determined from sensor measurements of acceleration from two players. The suitability and utility of the technique was then assessed by collecting acceleration data from an under-18 football team playing a practice game(4).
Transfer entropy is also used as a means of estimating nerve propagation from time-series signals on the activity of different neurons captured by encephalography (brain measurements). While a variety of standard analysis techniques are available for investigating how two signals are related to one another, including linear techniques such as cross correlation functions and coherence functions, and non-linear techniques such as mutual information and related relative entropy (Kullback-Leibler divergence), these are not well suited to analyses that also seek to determine the direction of information flow (cause-and-effect relationships).
This has led to greater use being made of transfer entropy over recent years because it can be used to determine these cause-and-effect relationships. It has also been shown that transfer entropy can be used when signals vary in a non-linear fashion. Accordingly, Hitachi devised its own analysis technique that converts acceleration data from two of the players in a game into a series of normalized discrete variables to calculate transfer entropy (see Figure 3). This was used to develop a system that represents the structure of latent information transfer between players in a team sport visually in the form of a network (see Figure 4).
A review of transfer entropy calculated using the acceleration data from wearable devices attached to football team players found that the transfer of information from the opposing team was higher by a statistically significant margin for those coordinated offensive plays that the coach deemed successful, suggesting that this can be used as an indicator of group performance in team sports. This indicates that the technique has the potential to provide coaches with a quantitative and objective way of easily assessing how player movements relate to one another during training.
Hitachi intends to continue collecting data over a longer period of time with a view to the future development of systems that can use data as a basis for determining training effectiveness and changes such as player growth.
Figure 3 — Calculation of Transfer Entropy between Players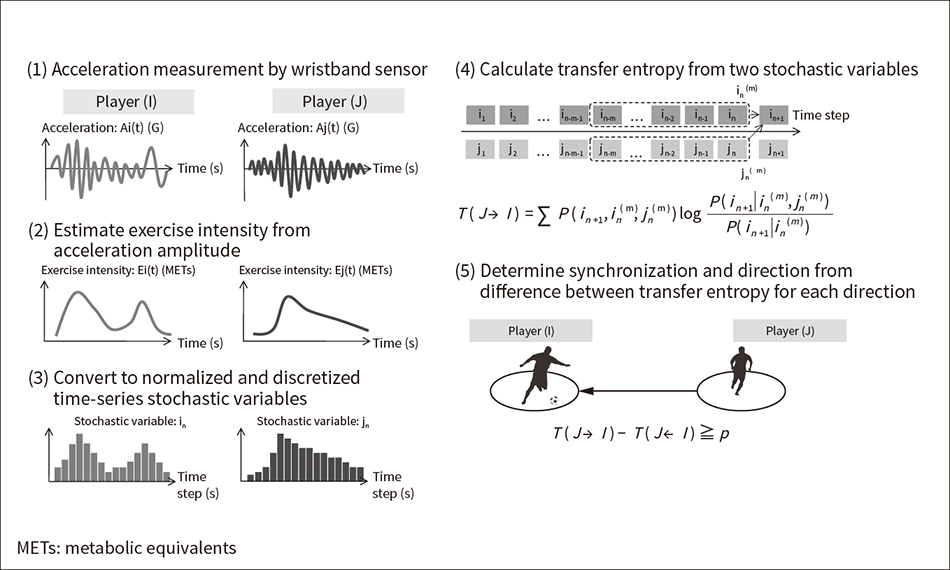 For two sets of time-series data (I and J), transfer entropy can be used to calculate the relative change in uncertainty for predicting the future state of I when done using only past I data and when both past I and J data are used.
Figure 4 — Representation of Information Propagation Networks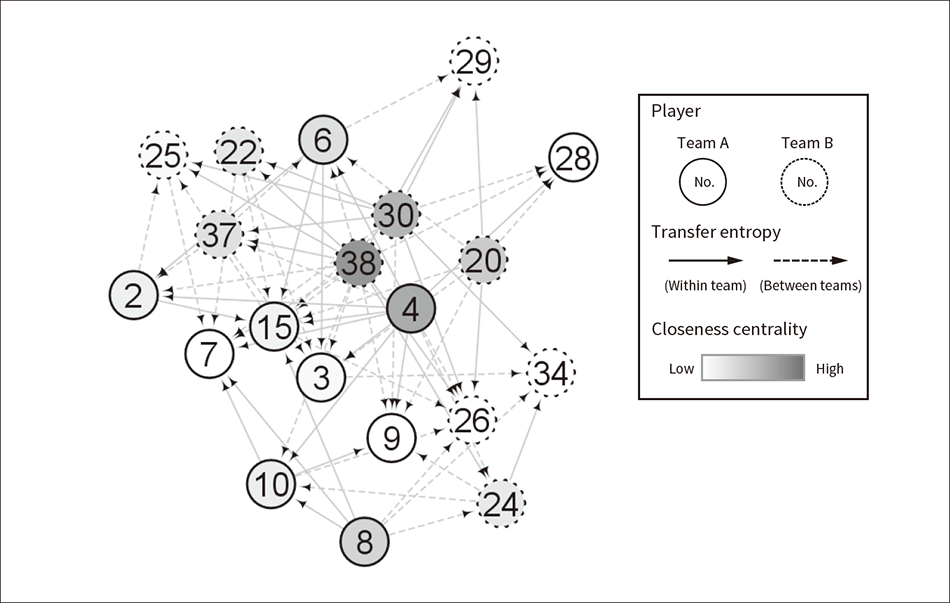 Whether and in what direction to make connections in the directed graph are determined based on when a bidirectional difference in the transfer entropy between two players exceeds a given threshold and there is a clear unidirectional transfer of information between the two players.
The transportation industry that underpins essential services also has a social responsibility to maintain safe operation, with this being its top management priority. It is the practice of the trucking industry in Japan to check driver condition before starting work so as to prevent crashes caused by their state of health. Unfortunately, this does not help assess the risk of accidents due to driver fatigue, stress, or inattention while on the road. While existing products are available for monitoring drivers as they drive, these are largely intended to detect sleepiness and cannot measure the fatigue that lies behind it. As a result, there is a lack of adequate measures for dealing with inattentive driving, recognized as one of the major causes of accidents. In response, Hitachi set out to create a smart safety technique that can automatically collect physiological information from drivers while they are driving to respond to changes in their physical condition in real time.
By using a non-invasive sensor worn on the shirt to collect heartbeat data while driving, this technique is able to detect the sort of driver fatigue that results in near-miss situations. Such heartbeat data was collected from more than 1,000 drivers and analyzed along with accompanying vehicle performance data to determine how the data relates to the autonomic nerve functions associated with near-miss situations and fatigue.
Using this data, a technique was first developed for using the vehicle performance data on its own to estimate how dangerously a driver is driving (risk of near-miss situations), thereby providing a quantitative assessment of the risk of near-miss situations in routine driving where no crashes occur. The results of a machine learning analysis of the large amounts of routine driving data made available by this system(5) found a strong relationship between the risk of near-miss situations and autonomic nerve function characteristics determined from variations in heartbeat, indicating that fatigue increases the risk of accidents (see Figure 5)(6). In other words, because use of this wearable device for continuously collecting heartbeat data enables driving accident risk to be predicted with a high degree of accuracy before fatigue or other deteriorations in driver condition become severe, it should be possible to prevent accidents by providing a real-time notification to the driver or their supervisor.
Hitachi plans to utilize this technique to improve driver safety and operational management under the new normal by offering it as a service and marketing it not only for trucking but also to other potential applications in the wider transportation industry such as buses and taxis(7).
Figure 5 — Accident Risk Prediction Using Feature Values that Correlate Strongly with Near-miss Situations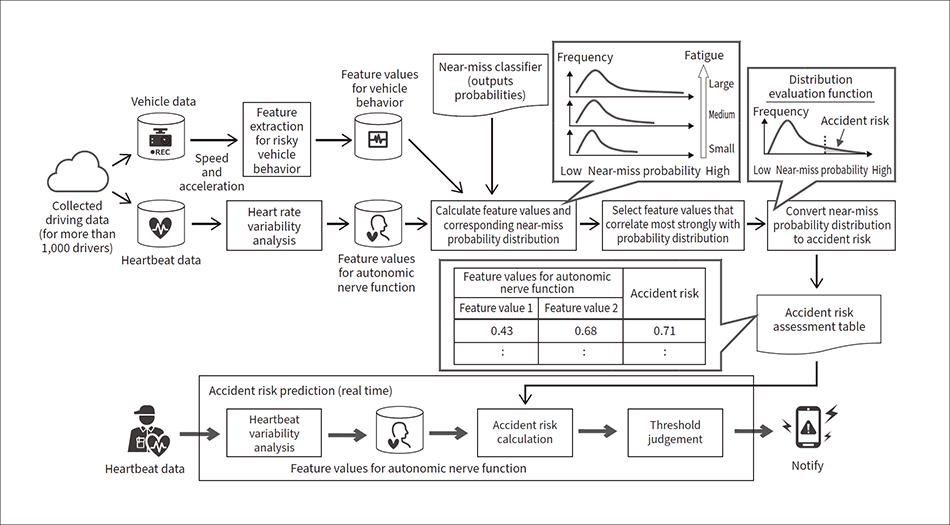 Hitachi developed an algorithm for using collected driving data to assess the risk of a driver being involved in an accident. The driving data includes vehicle data indicative of near-miss situations, such as sudden braking, and heart rate data that can be used to estimate the autonomic nerve function associated with fatigue. By compiling an accident risk assessment table that models the relationship between fatigue and the probability of a near-miss situation, it becomes possible to predict accident risk in real time from the driver’s heart rate data collected as they drive the vehicle.
This section describes DBMs developed by Hitachi for care and disease prevention. Section 3.1 introduces an ambient DBM for assessing muscle activity to prevent falls among the elderly, and section 3.2 introduces a portable DBM that uses finger motion analysis for the early detection of dementia.
Figure 6 — System for Assessing Exercise Effectiveness and Technique for Muscle Activity Analysis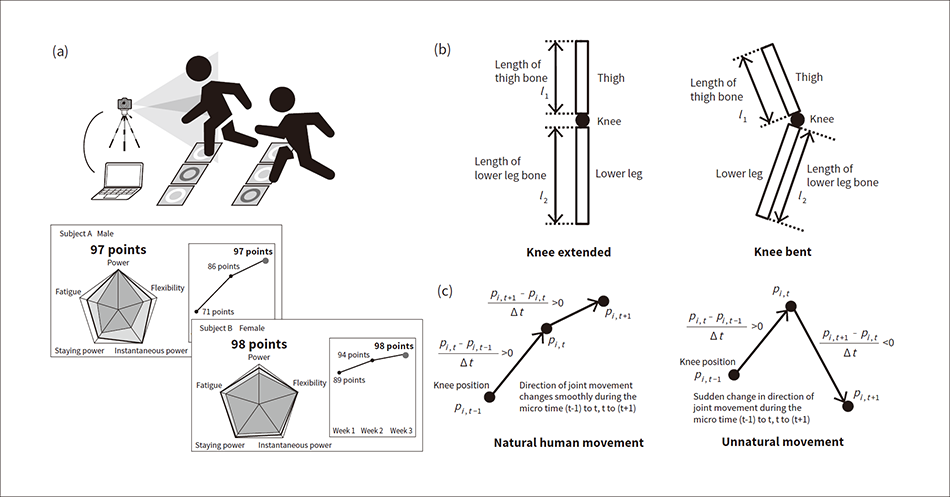 The diagram (a) shows how the system for assessing exercise effectiveness is used. The system determines the muscle activity of elderly subjects using a simple and enjoyable exercise in which they are asked to step on flashing floor panels in time with the lights. As shown in diagram (b), the rigidity of the human skeleton requires that distances between joints are the same regardless of whether the knee is bent or straight. Similarly, as shown in diagram (c), natural human movement is such that changes in the direction of joint position movement during the micro time occur smoothly.
Falls or broken bones resulting from muscle wastage are among the reasons for the elderly needing to go into nursing care. Regular exercise to maintain muscle strength helps prevent such outcomes. For such an exercise regime to be sustained, it is important to maintain and improve the participants’ motivation by providing tangible indications of its effectiveness. To achieve this, Hitachi has developed a system that uses the musculoskeletal analysis of images from an in-room camera to assess how the person is benefitting from muscle strength exercises in terms of five aspects of muscle activity, namely power, flexibility, instantaneous power, staying power, and fatigue (see Figure 6)(8).
Musculoskeletal analysis is a technique for using motion capture to measure joint positions and estimate the associated forces and muscle activity. In the case of clinical research, large-scale motion capture systems are used for this musculoskeletal analysis to meet the requirement for millimeter accuracy in the measurement of joint positions. In this system, in contrast, a commercially available three-dimensional (3D) camera is used, allowing for easier installation at aged care facilities. Unfortunately, the 3D camera produces variability in the measurement results, which degrades the accuracy of the musculoskeletal analysis.
To overcome this problem, Hitachi developed a correction algorithm for skeletal coordinates that uses the structure and biomechanical characteristics of the human body as a basis for highly accurate real-time correction of the joint position measurements(9). To perform this correction, the algorithm solves an optimization problem in which the constraints are that distances between joints remain constant due to the rigidity of the human skeleton [see Figure 6 (b)] and that changes in joint position occur smoothly [see Figure 6 (c)]. Use of the algorithm reduced the variability in the measurements to approximately one-third of the level in the uncorrected data.
When trialed for three weeks on six residents of a retirement home, use of the system succeeded in maintaining or improving motivation for persevering with the exercise program among five of the six participants. In the future, Hitachi intends to further improve the accuracy of the system through trials with a wide variety of customers with the aim of making services that can be wholeheartedly enjoyed by the elderly widely available.
Figure 7 — Results of Finger Motion Analysis of Dementia Patients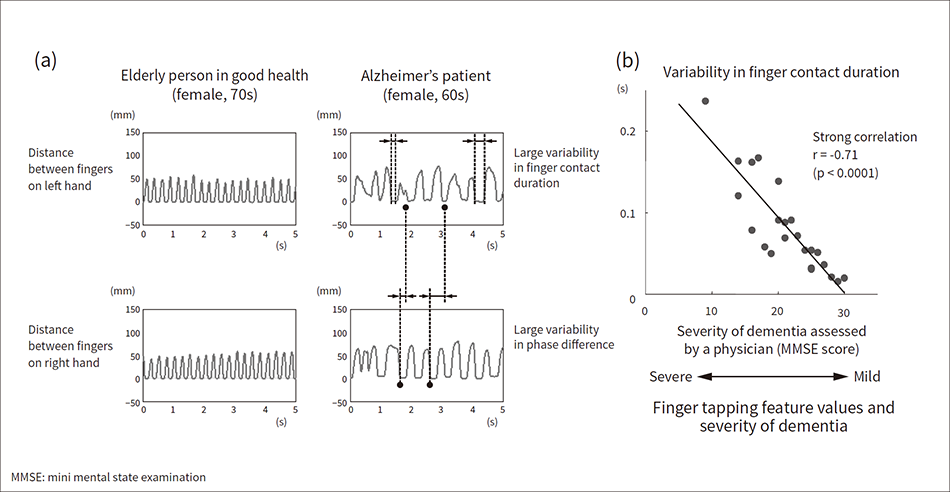 The graphs (a) show the typical waveforms obtained for anti-phase finger tapping motion. The waveform for the Alzheimer’s patient is erratic compared to that of the elderly person in good health. Graph (b) shows the correlation between finger tapping feature values and the severity of dementia assessed by a physician.
As society ages, the number of people suffering from Alzheimer’s disease continues to increase year by year. Detected early, however, onset of the condition can be delayed by drugs. Unfortunately, while screening tests for Alzheimer’s do currently exist, including blood testing, olfactory testing, and cognition testing conducted using a tablet computer, none of these are ideal, with issues that include the discomfort of blood sample collection, long testing times, and problems with accuracy.
To produce its own screening test, Hitachi looked at the motor skills associated with two-handed finger movements and developed a technique for analyzing the waveforms generated by tapping the fingers of two hands (repeated opening and closing of the thumb and forefinger). The measurement is performed using a finger tapping device with a magnetic sensor supplied by Maxell, Ltd. that is both simple to use and safe(10). Being portable, the device is also suitable for collecting measurements wherever is convenient at an aged care facility or hospital. The above analysis technique was used to obtain 21 basic feature values relating to finger tapping, including movement amplitude, tap interval, and phase difference between hands, and 23 additional feature values such as how long the fingers are in contact and the similarity between the movement waveforms from the left and right hands that indicates when rhythmic hand movement function is impaired.
Using this analysis technique, the National Center for Geriatrics and Gerontology (NCGG) collected finger tapping measurements from 23 outpatients with full or preclinical Alzheimer’s and 22 elderly people in good health. The results were then assessed in terms of how they correlated with the patients’ score on the mini mental state examination (MMSE) questionnaire(11), (12). A statistically significant difference between the healthy and Alzheimer’s groups was found for the measurements of alternately tapping the fingers of opposing hands [see Figure 7 (a)]. Similarly, a strong correlation with the MMSE score was found for the variability in the phase difference between the left and right hands for in-phase finger tapping (correlation coefficient r = -0.78) and how long the fingers were in contact during anti-phase finger tapping (r = -0.71) [see Figure 7 (b)]. Building on these results, further work is being undertaken on using this analysis technique as a means of assessing Alzheimer’s(13), (14).
If the further development of this technique can produce an accurate screening test that imposes little stress on the test subjects, it should facilitate the early detection of Alzheimer’s, helping to improve patient QoL and to reduce medical and nursing care costs.
Hitachi has been working to develop ambient, portable, app-based, and wearable DBMs that do not stress users and largely involve the measurement of bodily movement and vital signs. These are intended to promote health through health management, workplace safety, and sporting performance analysis, and to facilitate disease and care prevention in areas such as avoiding falls and the early detection of dementia. Future plans including expanding the range of measurements and scope of application around these core DBMs while also developing additional DBMs to provide a multifaceted view of people’s mental and physical health. Hitachi also intends to help improve people’s QoL in the health promotion and disease and care prevention sectors by providing support for appropriate interventions and behavioral changes based on DBM measurement results.
