Manufacturers and other companies will need to decide soon how they intend to reach carbon neutrality if this goal is to be achieved by 2050. It is crucial that they find ways to reduce CO2 emissions while remaining profitable and continuing to invest amid a changing external environment that includes price inflation and shortages of raw materials and energy. This article describes how a Global Supply Chain Simulation Service from Hitachi Solutions, Ltd. helps companies formulate supply chain strategy, including the application of numerical techniques to optimize both profitability and CO2 emissions reduction.

Figure 1 — Two Key Areas for Corporate Action on Carbon Neutrality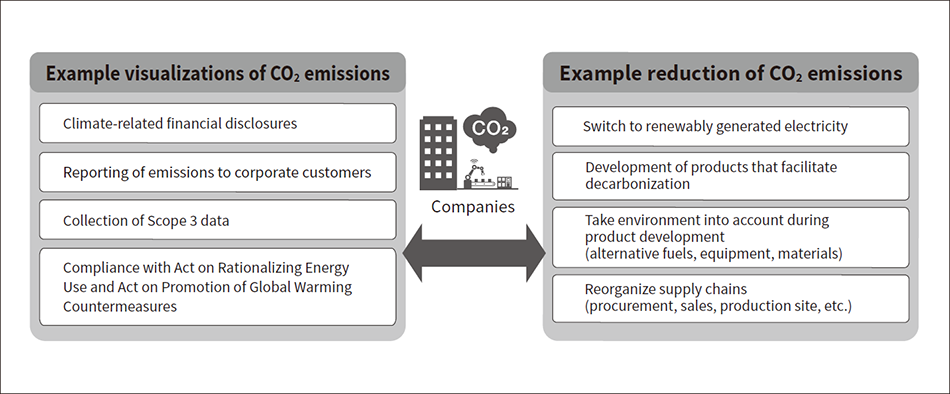 Achieving carbon neutrality calls for action by companies on both the visualization and reduction of CO2 emissions.
Decarbonization initiatives have been getting underway in earnest around the world since the adoption of the Paris Agreement at the 21st UN Climate Change Conference of the Parties (COP21) in 2015. Whereas efforts had previously been confined mainly to developed nations, the Paris Agreement marked a shift to action by all 196 nations participating in the UN Framework Convention on Climate Change. With Europe in the vanguard, more than 150 nations made pledges to achieve carbon neutrality by a given date over the years that followed. As of the end of COP26 in 2021, the countries or regions that had made such pledges accounted for 88.2% of total global carbon dioxide (CO2) emissions. Japan, too, is accelerating its activities, having announced its own 2050 target for carbon neutrality in October 2020.
The two key areas that companies need to address in order to achieve carbon neutrality are the visualization and reduction respectively of CO2 emissions. While there are many examples of the former being achieved using digital technology, instances of actual emissions reduction are rare. The visualization of emissions to better understand the current situation is important, however, measures that deliver actual reductions matter even more. So, the use of digital technology to reduce CO2 emissions is expected to become an important issue for society as a whole (see Figure 1).
Reducing CO2 emissions involves measures that come with capital and other associated costs. The electrification of plants, for example, is one of the measures recommended for emissions reduction that requires new investment. The Green Transformation League (GX League), a joint initiative between industry, government, and academia, plans to launch its emissions trading system (GX-ETS) on a trial basis from FY2023. This will require companies that fail to achieve their voluntary reduction targets to purchase offsets on the carbon credit market.
The Global Supply Chain Simulation Service described in this article can predict future CO2 emissions and assess the effectiveness of proposed reduction measures by using digital twin technology to replicate supply chains in virtual space and simulate production and sales. As the simulation predicts key performance indicators (KPIs) such as sales and profit as well as CO2 emissions, it helps companies take account of both corporate management and emission reduction considerations when devising strategy.
The Global Supply Chain Simulation Service is a cloud-based service developed to improve supply chain resilience. A function for simulating CO2 emissions was added in April 2022 to facilitate work toward carbon neutrality, providing the ability to predict emissions across the supply chain.
The emergence of COVID-19 has brought greater uncertainty. The raw material shortages and price increases, higher fuel prices, and citywide lockdowns of 2022 led to shipping delays and brought on a variety of problems, including geopolitical risk and higher exchange rate volatility. This made the formulation of an appropriate supply chain strategy an issue of great importance for management. The Global Supply Chain Simulation Service uses a predefined supply chain model and master data on sales, production, procurement, and transportation to replicate and simulate a company’s supply chain in a digital environment.
The inputs to the simulation are: (1) the supply chain model, (2) procurement data (costs and capacity), (3) plant data (production capacity, bills of materials, fixed overheads, and variable costs), (4) transportation data (costs and tariffs), and (5) demand data (demand, selling prices).
On a technical level, the simulation uses a numerical analysis technique called linear programming. In theory, this technique can calculate the sales and production plan that maximizes company-wide benefits while staying within the constraints imposed by the plant production capacity and the delivery capacity of suppliers. Consider the example of a company with production facilities for the same product in both Japan and China that needs to manufacture 100 units. To determine the optimal solution (the combination of production and sales that delivers the highest profit), the simulation performs calculations for all possible combinations (making 100 units in Japan and none in China, 99 units in Japan and one in China, and so on…). The outputs include: (1) sales and profit, (2) the product mix and production quantities that maximize profit for a given demand, (3) the product mix and operating times for each item of plant, and (4) the mix and quantities of purchased products.
By defining what-if scenarios, the simulation can also be used to assess future possibilities. One example would be to simulate possible changes in procurement capacity and costs in anticipation of future price rises and shortages of raw materials, using this to determine what impact they might have on the company’s sales and profits. This allows for pre-emptive measures as well as prompt action if one of the scenarios eventuates (see Figure 2).
Figure 2 — Use of Digital Twin in Supply Chain Resilience Strategy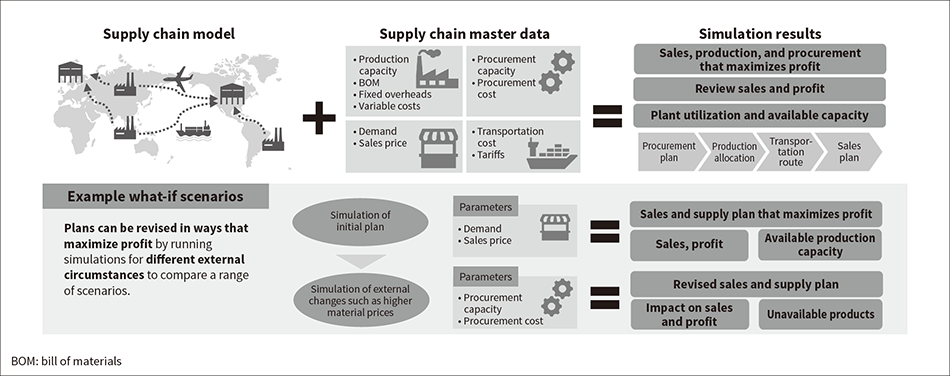 Numerical analysis can assist with the formulation of sales and supply strategies that maximize profitability. The best plan can be identified by comparing different what-if scenarios, using these as a basis for determining the optimal mix of sales and production volumes, allocation (choice of production sites), and purchasing quantities.
This section describes the newly added function for simulating CO2 emissions. The Greenhouse Gas Protocol (GHG Protocol) has set international standards for calculating and reporting CO2 emissions at all steps along the value chain. These are divided into three scopes. Scope 1 refers to direct emissions of GHGs by the reporting company (the burning of fuel and other industrial processes). Scope 2 refers to indirect emissions associated with the use of electricity, heat, or steam supplied by other companies, and Scope 3 refers to those indirect emissions not covered by Scope 1 or Scope 2 (emissions that occur at other companies but result from the reporting company’s activities)(1).
The Global Supply Chain Simulation Service can simulate CO2 emissions for Scope 1, Scope 2, and categories 1, 4, and 9 of Scope 3. Category 1 relates to purchased products and services, category 4 to upstream transportation and delivery, and category 9 to downstream transportation and delivery. These three Scope 3 categories were chosen because they are directly influenced by the movement of goods along the supply chain.
The additional information used for simulating CO2 emissions is: (1) procurement data on the per-unit CO2 emissions of each purchased product, (2) plant data on the per-unit CO2 emissions during the production process for end products and intermediate goods, (3) plant-wide Scope-2 CO2 emissions (electric power use, etc.), (4) transportation data on per-unit CO2 emissions during shipping and the border carbon taxes levied on the CO2 amount. The addition of this extra input data allows companies to use the digital twin of the supply chain to simulate how much CO2 will be emitted by their sales and production plans (see Figure 3).
Figure 3 — How Per-product and Total Supply Chain CO2 Emissions are Calculated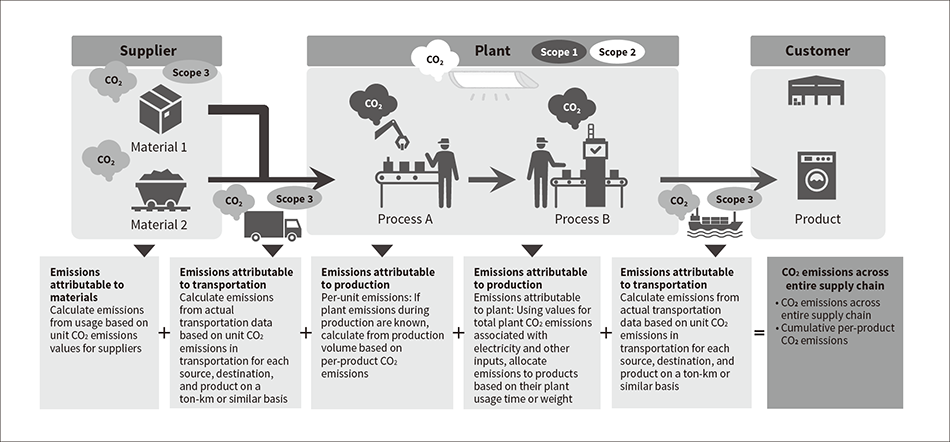 The Global Supply Chain Simulation Service uses master data on the CO2 emissions at each step in the supply chain to calculate total and per-product CO2 emissions.
The Global Supply Chain Simulation Service allows companies to participate in emissions trading systems (ETSs) by setting a maximum limit on CO2 emissions at the company or site level.
The European Union (EU) has introduced one such scheme (the EU-ETS). While this initially allocated free credits based on historic emissions, credits must now be purchased through an auction. Japan’s GX-ETS works by allowing companies that beat their own voluntary reduction targets to sell the excess on a carbon credit exchange while those that fail to meet their targets must purchase offsetting credits from the exchange. A further scheme is also planned whereby a private agency will be commissioned by the government to assess the appropriateness of companies’ voluntary reduction targets(2).
It is possible to formulate production and sales plans that maximize profitability while remaining within the maximum limit for CO2 emissions. Reducing raw material prices is not the only way to improve profitability. Companies can reduce spending on carbon credits by using raw materials that come with lower CO2 emissions, even if they are more expensive than those of other suppliers. In some cases, they can even achieve higher profits from lower sales. The Global Supply Chain Simulation Service is able to identify such opportunities (see Figure 4).
Figure 4 — Interoperation with Emissions Trading (Carbon Pricing)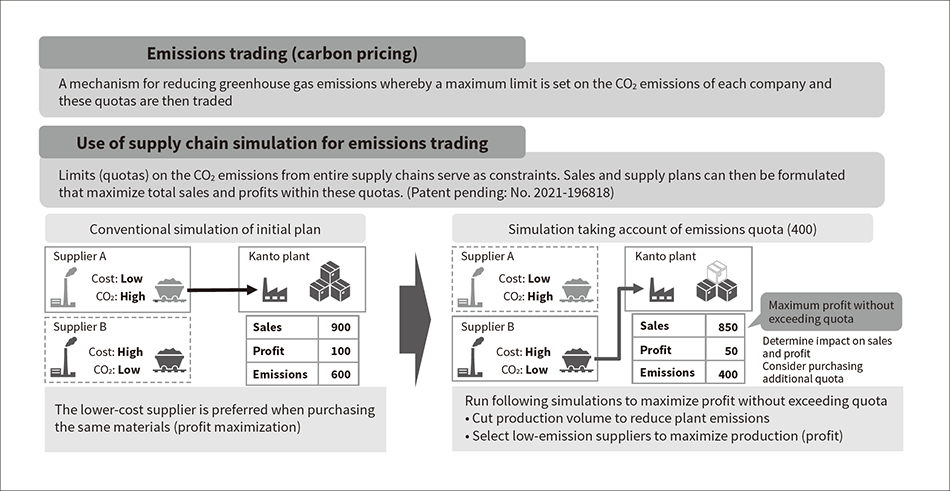 Utilize linear programming to obtain the production and sales combination that maximizes profit while remaining within the maximum limit on CO2 emissions.
A draft of the “Basic Policy for the Realization of GX” with a 10-year roadmap was presented at the fifth meeting of the GX Implementation Council chaired by the prime minister in December 2022(3). The draft basic policy considered the progressive introduction of auctions for power generators and third-party private-sector certification of corporate reduction targets under the ETS together with the adoption of carbon levies with uniform emissions pricing. It stated that, rather than adopting such measures immediately, they should be implemented over a period of time set aside for concerted action on GX.
While work toward carbon neutrality to date has mainly involved voluntary corporate initiatives, this push from government is expected to further accelerate activity. In the future, Hitachi intends to utilize the Global Supply Chain Simulation Service to help both companies and wider society achieve carbon neutrality.
