Effective operational methods for attracting customers discovered at nonowa Kunitachi operated by JR Chuo Line Community Design Co., Ltd.
August 25, 2021

Fig. 1 By applying CPS, we discovered convincing operational methods that fit the status quo of nonowa Kunitachi shopping mall
Hitachi, Ltd. has developed a prototype Cyber Physical System (CPS) for supporting the PDCA*1 cycle in facility operation geared toward a community-based shopping mall, which is a starting point of community revitalization. The prototype presents effective operational methods through AI analysis after incorporating the following data into Digital Twin*2 in cyberspace:
This enables the shopping mall owner, site supervisors and tenant owners to devise their own convincing operational methods which fit the status quo of each outlet, such as customer base and geographical characteristics. Hitachi carried out a demonstration experiment at nonowa Kunitachi, a shopping mall adjacent to JR Kunitachi Station and operated by JR Chuo Line Community Design. The company confirmed that traditionally incomprehensive purchase trends and effects of operational methods are quantifiable, which has lead Hitachi to discover effective operational methods. Going forward, Hitachi aims to put this CPS into practical use as a solution supporting operational methods tailored to characteristics of domestic and global shopping malls. Hitachi is enthusiastic about contributing to regional community revitalization.
In a bid to conduct the demonstration experiment, Hitachi was provided with the shopping site data and miscellaneous data as well as knowledge and views of the site experts from JR Chuo Line Community Design Co., Ltd. (former name when the experiment was carried out: JR Chuo Line Mall Co., Ltd.).Hitachi is scheduled to disclose a part of our findings at FIT2021 held online by Tohoku Gakuin University from August 25 - 27, 2021.
CPS, which supports the PDCA cycle of facility operations, is comprised of the following technology:
The customer base and characteristics of customer purchase trends vary depending on the entrance of the shopping mall, and the variance is attributed to different adjacent zones including residential area, used transportation and so forth. In order to capture these gaps, Hitachi traced the details of individual customer behaviors within outlets, and referred these behaviors to purchase data based on continuously shifting POS data. However, customer privacy had to be taken into consideration. Accordingly, Hitachi developed a technology that extrapolates contribution to sales by customers who enter the shopping mall from each entrance, with no detailed trace of individual purchase behaviors.
Through this technology, probabilistic regression analysis was carried out by integrating data on the number of daily visitors coming into each entrance of the shopping mall as well as chronological sales data. The visitor data was measured by LiDAR sensor which is able to acquire and measure customer flow with no identification of individuals. Hitachi was then able to calculate correlation of the number of visitors from each entrance with sales. Based on the correlation, the average purchase value of visitors from each entrance was estimated. By combining the average purchase value with number of visitors, Hitachi was able to quantitatively extrapolate the contribution to sales of visitors for each entrance.
By separately analyzing weekday and weekend chronological data, Hitachi was able to evaluate the contribution to sales for each category. Furthermore, it is possible to analyze the contribution by day of the week and to extrapolate the purchase ratio of visitors (a ratio of purchasing once or more) for each entrance. By utilizing these extrapolated values, Hitachi was able to rationalize business decisions like, "which entrance should be prioritized for posting advertisements," These judgments have been traditionally made based on the experience and assumptions of the site expert.
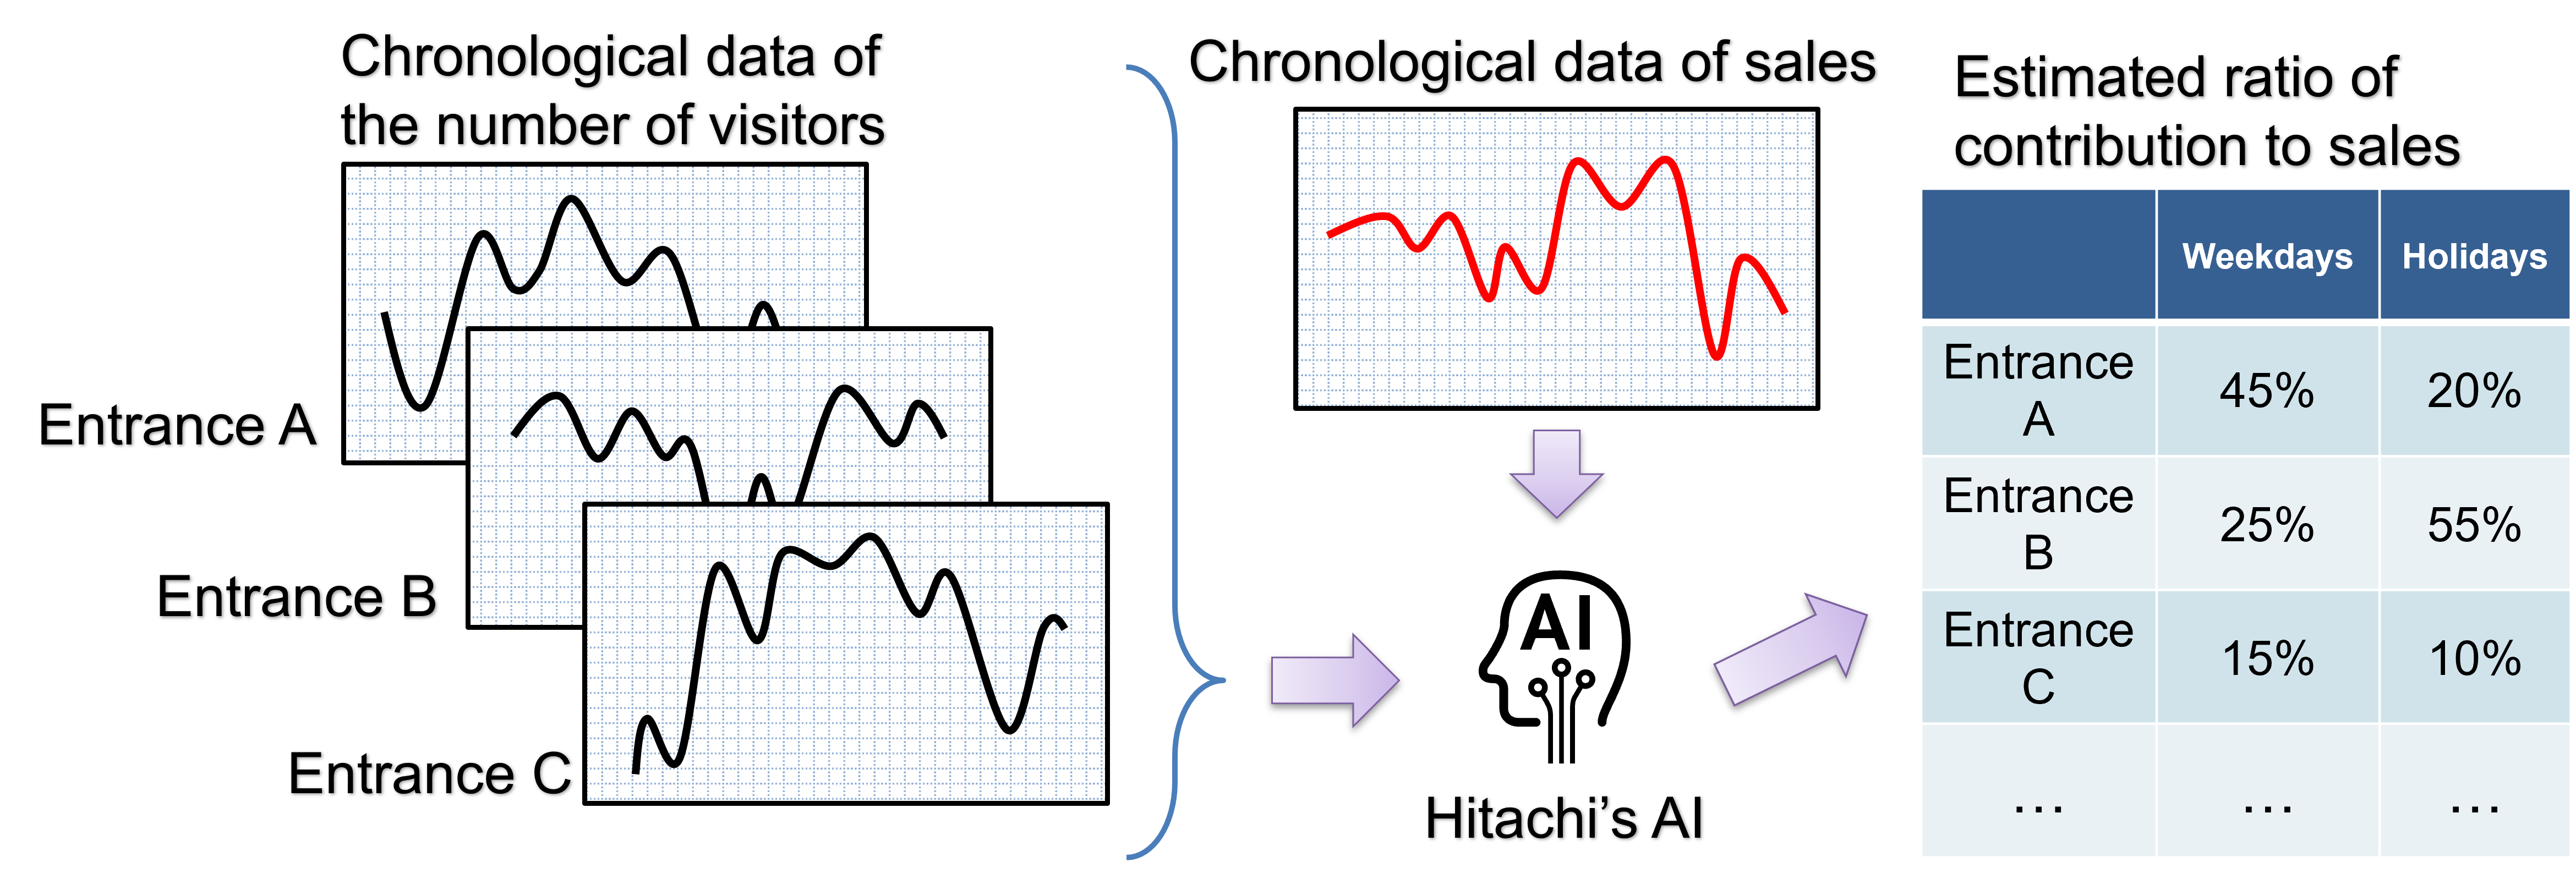
Fig. 2 Outline of technology that extrapolates contribution to sales
Traditionally, in the case of building a machine learning model that predicts operational methods' effects by collecting data regarding previously implemented operational methods and the effects, a great deal of historical data is necessary. In addition, due to the influence of data and parameters used for machine learning, the prediction basis of the AI is not stable*5 and there are times when one fails to attain a sense of satisfaction with the concerned site.
The technology Hitachi has developed realizes highly accurate, convincing prediction of operational methods' effects using small amounts of data by directly incorporating the knowledge and views of site experts including site supervisors and tenant owners into machine learning models in addition to historical data.
The knowledge and views incorporated into the machine learning model are: (1) correlation between specific factors and their effects; and (2) ranking of factors’ significance. Concretely, in (1), site experts offered view such as, "There exist direct ties between this factor and the effect," or "If this factor grows, the effects increase monotonically."(Fig. 3-1).
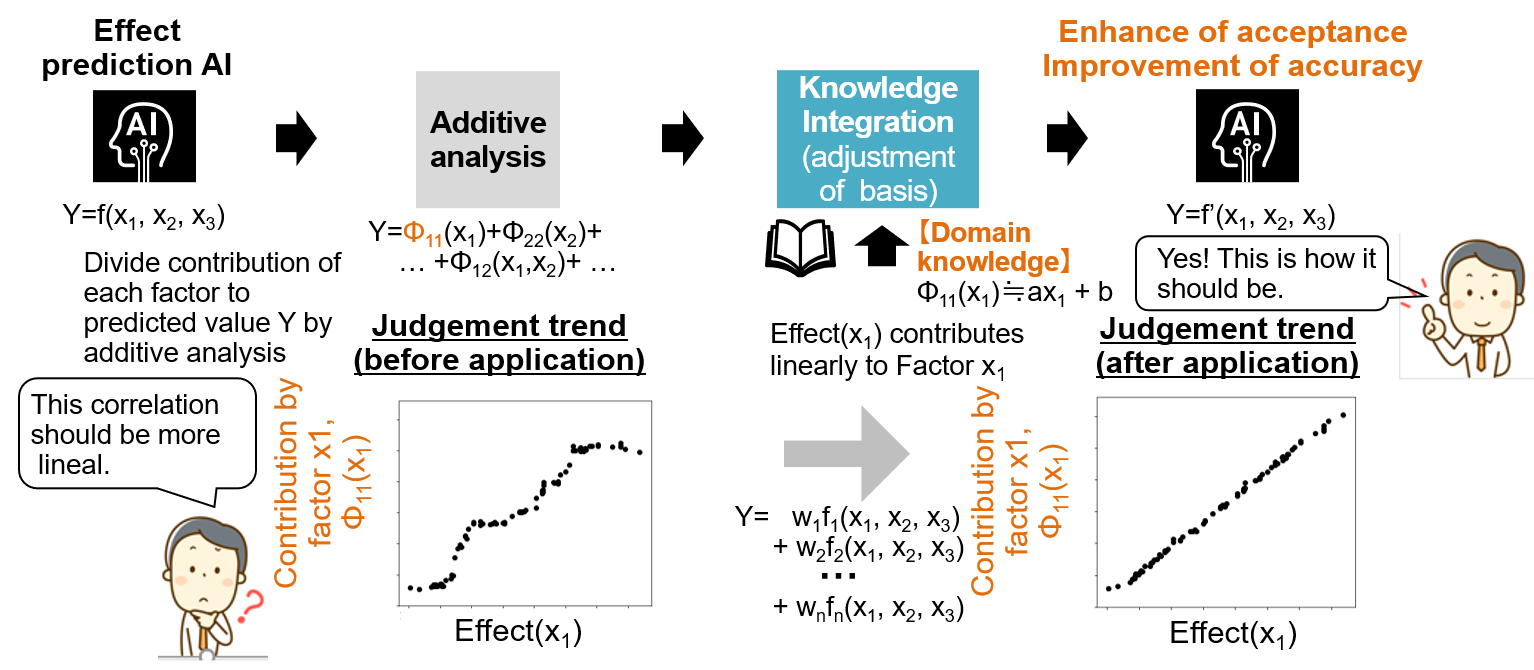
Fig. 3-1 Infusion of experts' views into prediction model in method (1) (Correlation between specific factor & the effect)
Next, several prediction models with different prediction bases were constructed based on historical data and the connection weights of said prediction models were adjusted to make the final prediction model coincide with the originally offered knowledge and views. In this way, Hitachi was able to construct, even with small amounts of data, highly accurate prediction models which agree with experts' knowledge and views. Moreover, in (2), Hitachi constructed multiple prediction models with differing prediction bases based on historical data and ranked the models from the viewpoint of consistency with the experts' views, which led the final prediction model being more convincing. (Fig. 3-2)
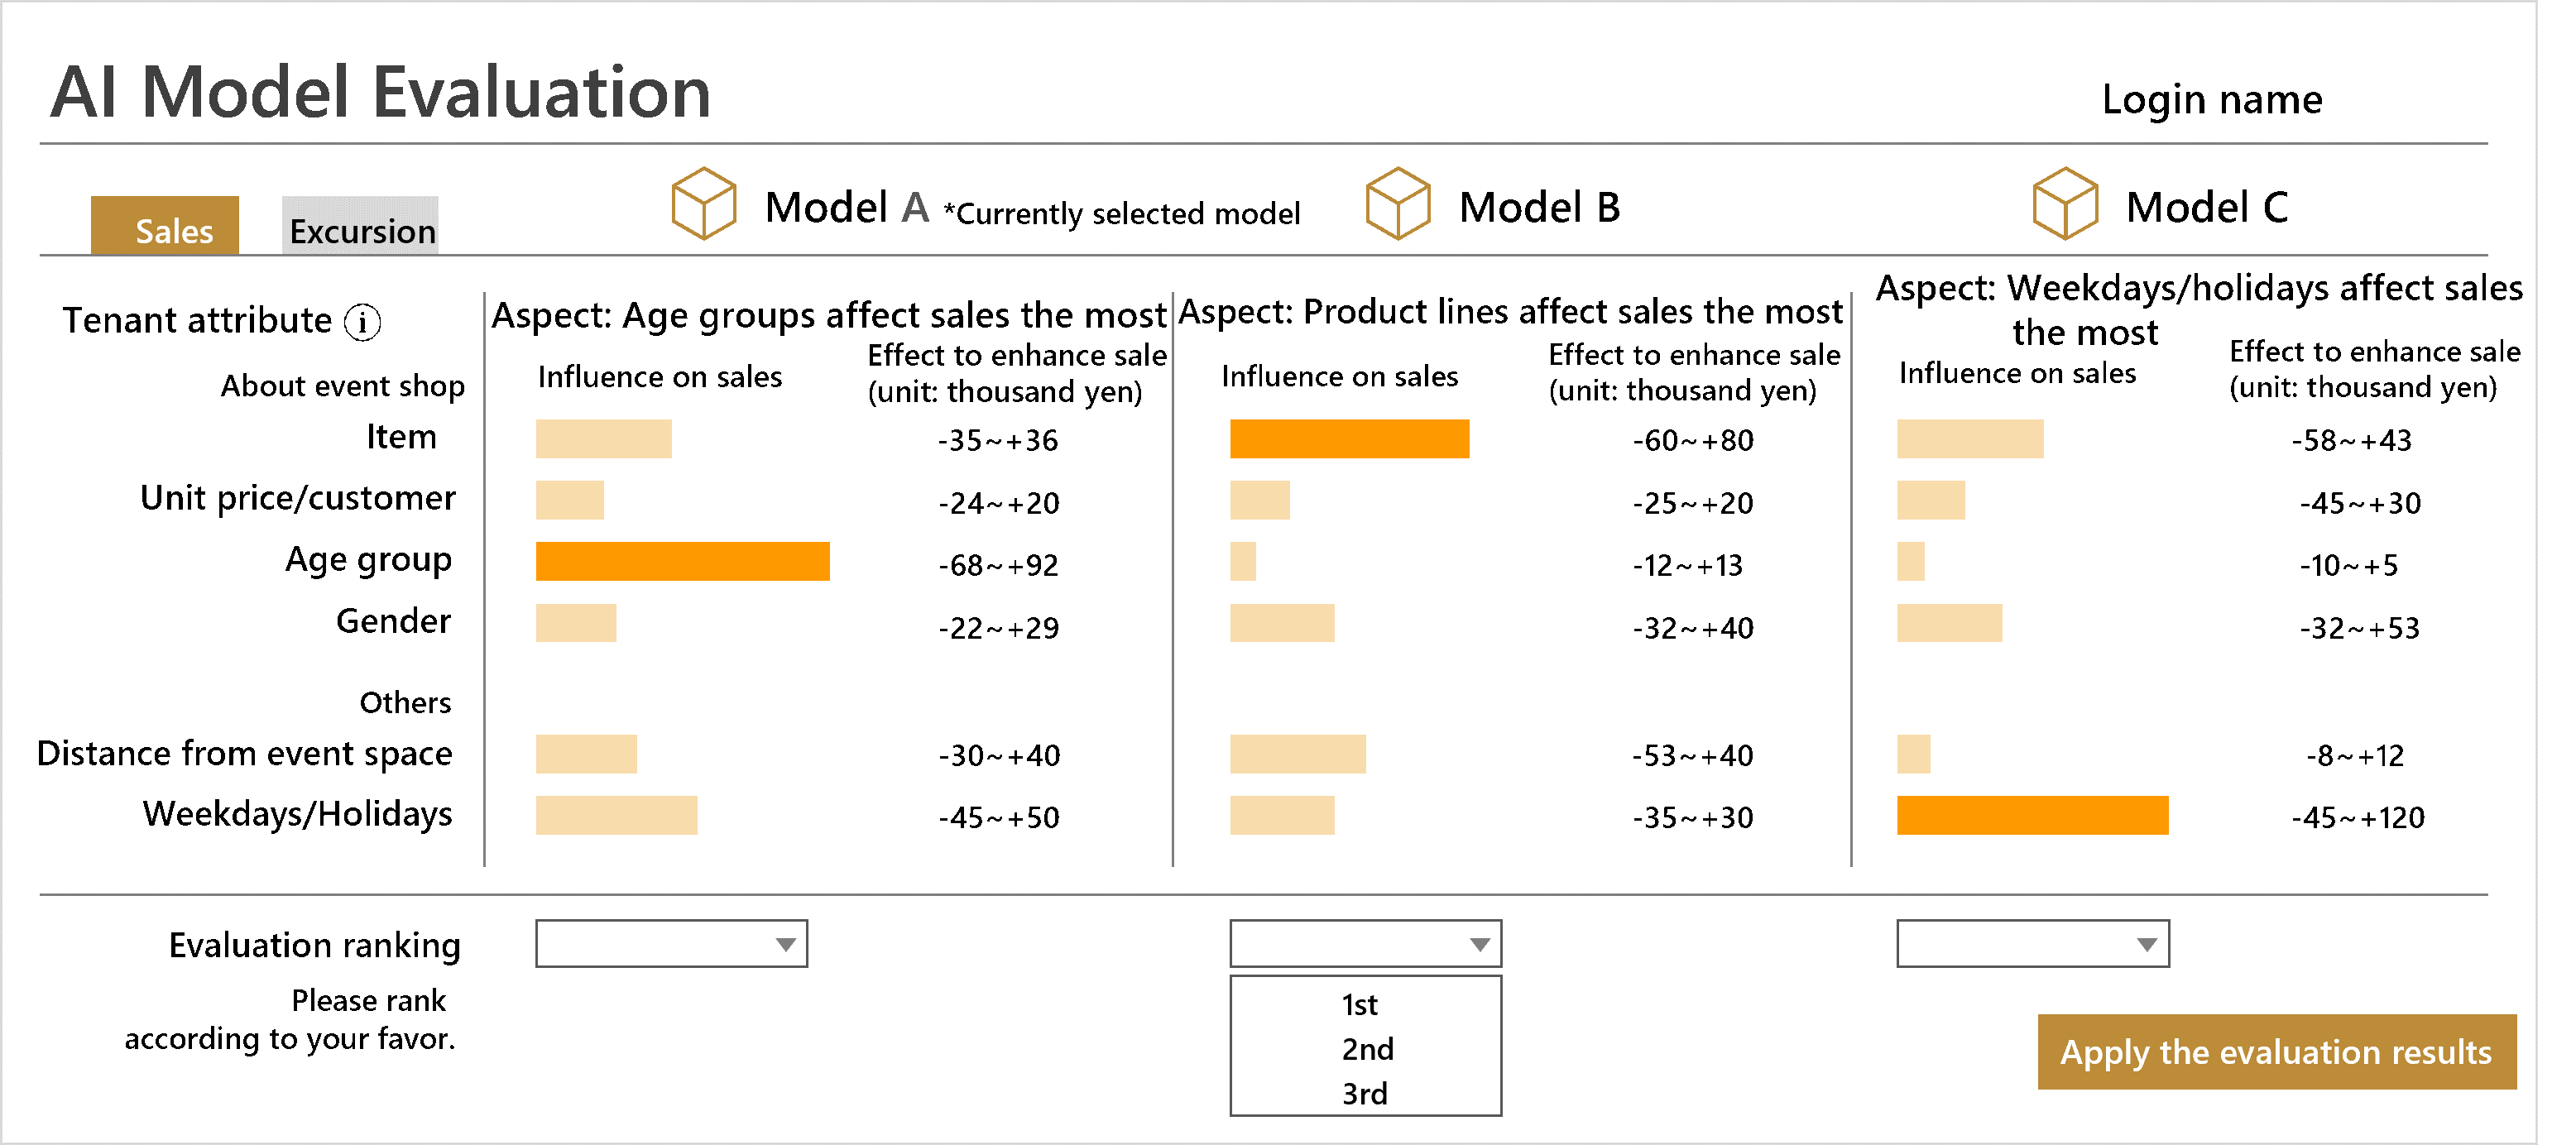
Fig 3-2 Infusion of experts' views into estimate model in method (2) (Ranking of factor significance)
Traditionally, the effects of operational methods are verified through the following steps. In general, the effects are verified through a before-and-after comparison of the situation once operational methods are implemented.
However, with the above method, it is difficult for AI to propose effective operational methods in accordance with the continuously changing retail environment and purchase trends amid the prevailing COVID-19 pandemic.
In the demonstration experiment, Hitachi developed a continuously extracting method for effective operational strategies through the following steps:
In the below graph (Fig. 4), the light blue band indicates the predicted number of visiting customers when no operational method was implemented and the red line indicates actual number of visiting customers. It can be seen that distributing flyers on December 26th in the neighborhood of the shopping mall resulted in a significantly larger number of visitors being drawn to the shopping mall on December 28th, the first weekend after flyer distribution, than predicted. This corroborates the advertisement effect of the distributed flyers.
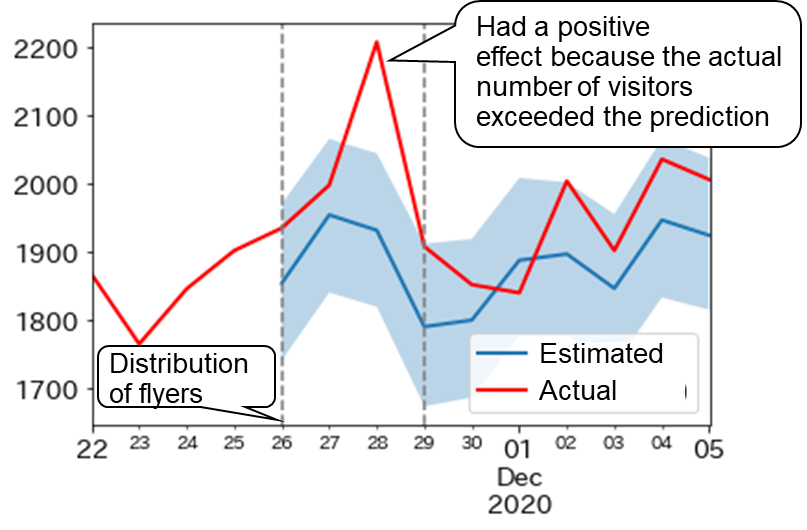
Fig. 4 Quantification of effects of implementing operational method by comparing with estimated values in the event of no implementation of operational method
For more information, use the enquiry form below to contact the Research & Development Group, Hitachi, Ltd. Please make sure to include the title of the article.
