11 May 2020

Remish Leonard Minz
R&D Centre, Hitachi India Pvt. Ltd.
Protecting IT infrastructure from cyber-attacks requires network risk detection and response strategy. The effort required to protect with this strategy depends on the number of resources in a network to be protected. Widespread practice is to scan vulnerabilities in the devices in the IT network and mitigate those vulnerabilities by patching the vulnerable software with latest security patches. There are vulnerability scanners which scan the devices in the IT network of an organization in a routine manner and provide the vulnerability report to the IT security operator to get it patched. Mitigating all vulnerabilities in the IT network is a difficult task, due to less time to patch and the large number of vulnerabilities.
Existing techniques provide severity scores for each of the vulnerabilities provided by the scanners. However, the severity scores based on which the IT security operator prioritizes his action are misleading due to non-consideration of IT network topology in calculating the score. Devices which have direct access by an attacker are more vulnerable compared to devices that do not have direct access by the attacker. In case of an external attacker targeting the IT infrastructure from the Internet, the existing scoring system provides vulnerability scores based on the assumption that all devices in the network are equally accessible, as show in Figure 1 (a). Devices in any IT infrastructure, however, are arranged in a predefined hierarchical structure, defined by the design of the network topology as described in Figure 1 (b). A highly severe vulnerability score of 0.9/1.0 in a Gateway Server is more vulnerable than in an Application server with the same vulnerability score of 0.9/1.0.
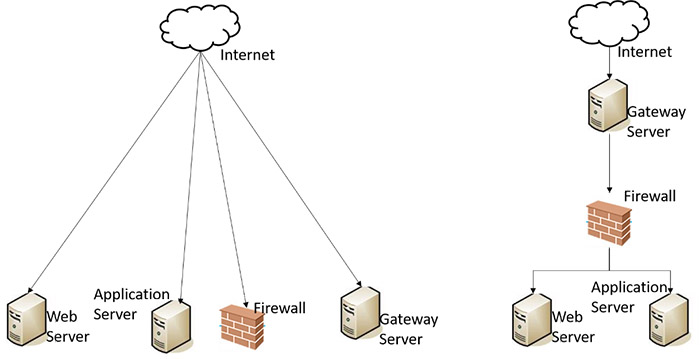
Figure 1(a): Existing technique assumption of device access (b)Acutual access
We call our system SRMS. It stands for Security Risk Management System. SRMS provides a scalable mathematical model to calculate more accurate vulnerability scores by considering network topology along with existing severity scores. The SRMS model can be used for calculating vulnerability scores for a large IT network and take mitigation action to prevent the infrastructure from cyber-attacks.
The source of a vulnerability score is vulnerability repositories, like NVD [1]. These repositories maintain a frequently updated database of vulnerabilities. The score provided to these vulnerabilities represents how easy it is to exploit the vulnerability and get control of the device.
The formula to calculate the score is called Common Vulnerability Scoring System (CVSS) [2]. In current approach, the CVSS score and the network topology structure is modeled to improve the accuracy of the risk in the network. Using this two information, SRMS provides an attack path originating from resource exposed to threat actors such as via the Internet or internal attackers. This attack path is considering a new vulnerability score generated by modeling network topology and CVSS score as shown in Figure 2. The new vulnerability score reflects the actual difficulty of the attacker to exploit the vulnerability with respect to the network topology.
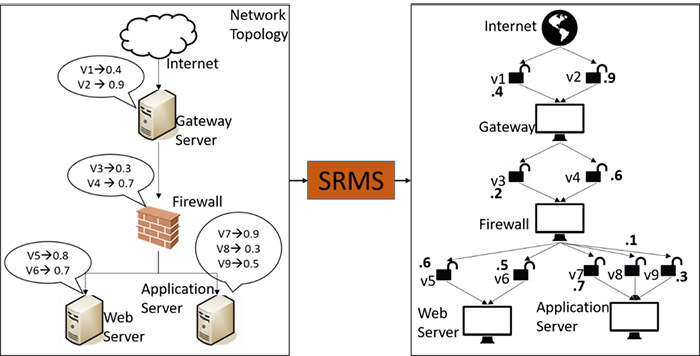
Figure 2:New vulnerability score by SRMS
SRMS comprises of two parts. The first part is the interface which takes CVSS scores and network topology information as input. The second part uses the information provided by the first to model a Bayesian network, conduct the simulation of the Bayesian network and evaluate the new vulnerability scores. Figure 3 shows the overview of the technology.
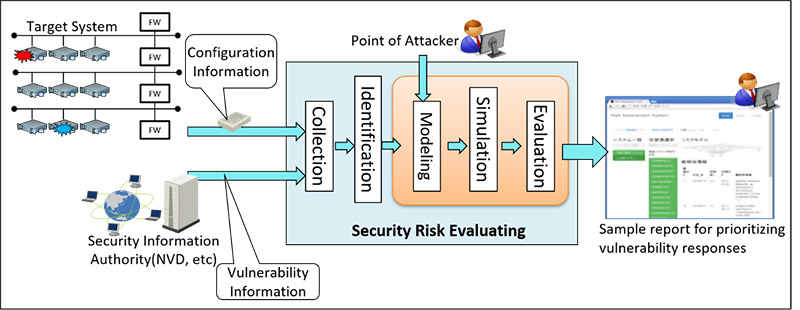
Figure 3:Overview of the technology
The two parts of the system are modular in design. The first part can be altered to accept the CVSS score and topology in different forms, without affecting the modeling and simulation part. It allows flexibility for the IT operator to provide input based on the availability of vulnerability and topology information. The information can be provided in a manual, semi-automated or automated manner based on availability. In our current implementation, state-of-the-art scanning software is integrated to automatically collect CVSS scores of individual resources in the network. Figure 4 shows the system architecture of the implementation.
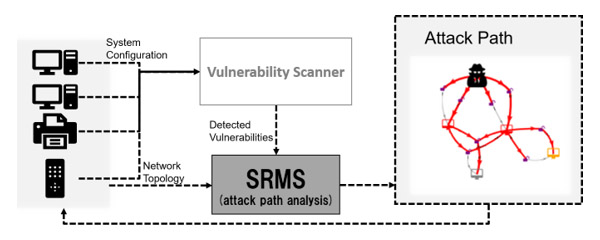
Figure 4:System Architecture
Current research proposes an efficient modeling of IT Infrastructure for attack path analysis. Existing methods focus primarily on the modeling of an attack path [3][4]. SRMS focusses on the scalability by efficient modeling technique by modeling the asset level as nodes. A fine grain model increases the size of the Bayesian network and the inference of posterior probability takes more time to evaluate the values. A much coarse grain model will not provide enough insights for the IT administrator. This technology provides the right level of abstraction as in practice, largely patching or attack detection and protection are done on the asset level. This technology can help network administrators maintain the risk of cyber-attack to acceptable levels by providing valuable and actionable insights like which asset to prioritize on patching or where to increase monitoring. This shows that fundamental tools like a Bayesian network or Probabilistic Graphical Models, in general, are scalable to an extent that it can be applied to cyber security operations of a large IT network. For more detail of the technology and its benefits, please refer to the published paper, “Cyber Security Using Bayesian Attack Path Analysis ” [5] which was selected for a best paper received best paper award at CYBER 2018 [6]
*If you would like to find out more about activities at Hitachi India Research & Development, please visit our website.
