21 August 2020

Sharath Kumar
R&D Centre, Hitachi India Pvt. Ltd.
With the increase in use of interconnected sensors, smart machines in industrial operations produce a continuous stream of sensor data, event data, and contextual data. In order to improve operational efficiency of these systems, the data needs to be intelligently managed and analyzed. To align with this trend, Hitachi has developed many innovative analytics solutions [1] utilizing big data technologies to process and extract insights from a large amount of heterogeneous data coming from customer systems. At the same time, there is a strong customer demand for complex big data analytics applications involving IT x OT, that is the integration of IT systems with OT systems to achieve connected and optimized industrial operations. One approach to developing such applications is to build them from scratch for every customer (Figure 1-A). However, this approach is time-consuming and has the following drawbacks [1]:
To overcome these drawbacks, we developed the Common Analytics Framework (Figure 1-B), which helps us to reuse existing solutions. It specifically helps to build analytics applications on top of it so that we can reduce development and deployment time.
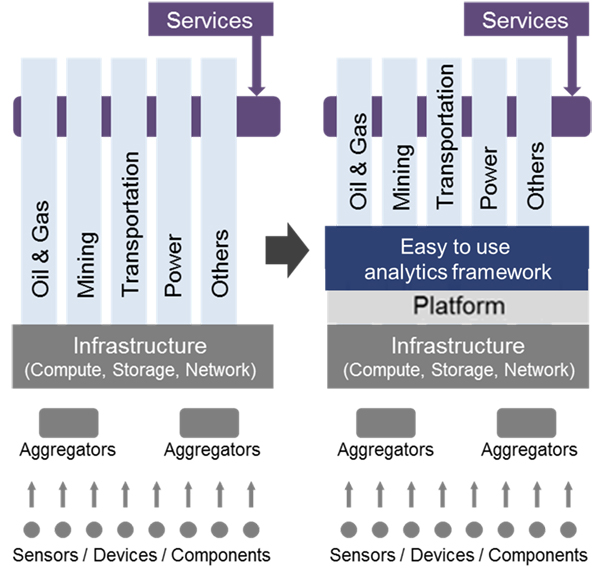
Figure 1-A: Existing system Figure 1-B: Proposed system
Figure 2 shows the operation of our Common Analytics Framework. It operates in two phases as Application Building Phase (Phase 1) and Use Phase (Phase 2).
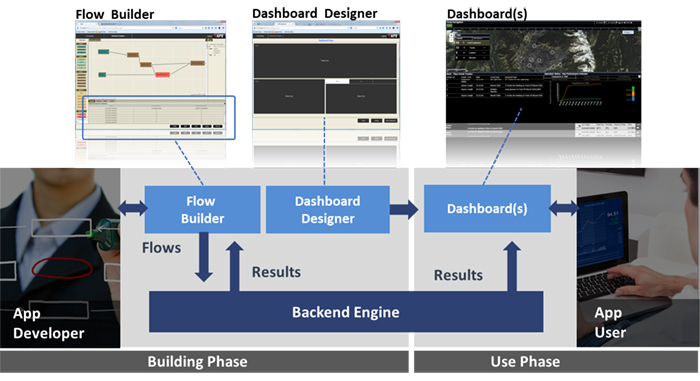
Figure 2: Common Analytics Framework- Operation
In Phase 1, the App Developer will specify an analytic flow with a graphical Flow Builder. The flow will be executed on one or more of the data processing in the underlying platform with the help of backend engine. The results will be displayed on the Flow Builder in form of a table/plot. If the results are in line with the customer’s requirement, the flow will be added to the application Dashboard via the Dashboard Designer.
In Phase 2, the App User will receive the application as a set of dashboards, an underlying platform, and logic to execute flows comprising the dashboard on the platform. The application user will access the dashboards built by the App Developer. The underlying flow will run at respective time granularities specified and the user will be able to deeply dive on the analytic results displayed in the dashboard.
Figure 3 shows the architecture of the Common Analytics Framework. The framework consists of the following modules to address the drawbacks in existing big data application development process vis-à-vis application developer needs.
Table 1: Analytics challenges addressed by the Common Analytics Framework
| Easy-to-use development framework is required for non-IT experts | Flow Builder & Dashboard Designer: Front end design which empowers both domain experts and data scientist alike |
| Plug-n-Play analytics function is required | Operator Definition Library: A large library of operators expressing analytics functions. |
| Support for various analytics platform is required | Backend Engine: Ability to harness different execution platforms for data processing needs |
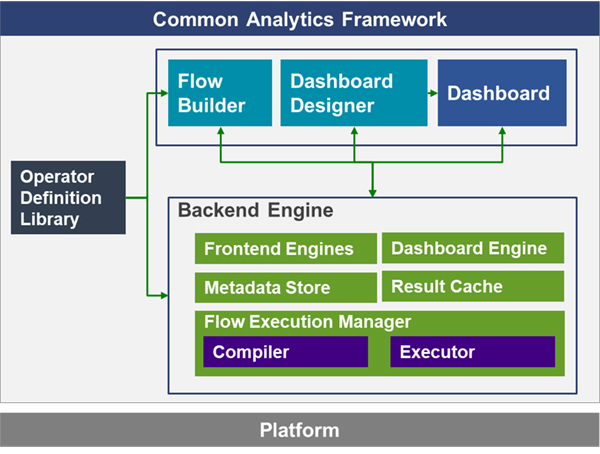
Figure 3: Common Analytics Framework - Architecture
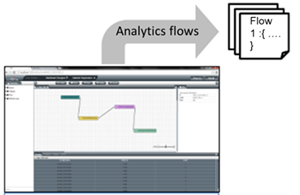
Figure 4: Flow Builder
Flow Builder & Dashboard Designer enable App Developers (domain expert or data scientist) to create analytics data flows and design dashboards with an easy-to-use GUI (graphical user interface). Using Flow Builder (Figure 4),
• The developer can draw analytic flows by placing and linking operators in drag-n-drop GUI.
• An example of flow creation using the operators is shown in Figure 5. Upon the creating the flow design, developer can compile the flow for verification, and if there are no errors, then they can execute the flow.
• The results can be viewed using result pane. The flows can be deployed for dashboard creation.
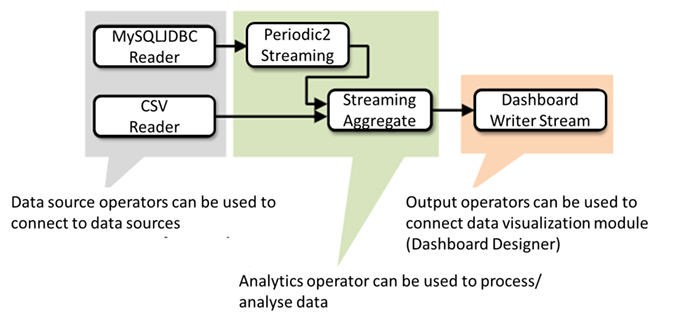
Figure 5: Analytics flow design example
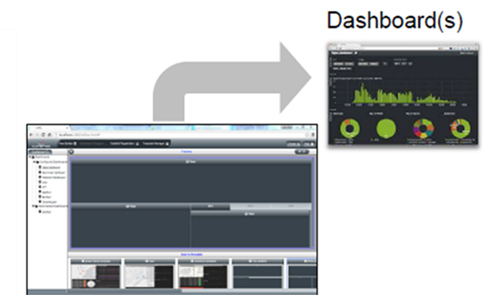
Figure 6: Dashboard Designer
The Dashboard Designer (Figure 6) module allows application developer to connect analysis flows designed using the Flow Builder and design dashboards using customizable templates and widgets i.e. charts (Bar, Map, Pie, line etc.,) to visualize results. The designed dashboards can be deployed at customer environments. This module enables interactive visualization of analysis results in real time.
Operator Definition Library stores a hybrid list of analytics operators, which can be used to perform common analytics operations on variety of data. The operators allow developers to express analytics needs ranging from simple queries, statistical functions to sophisticated machine learning algorithms and helps in creating knowledge base of analytics operators which can be reused in future. The library can also be used to store advanced analytics operators from OT x IT solutions such as predictive maintenance.
Backend modules which include analytics Flow Compiler and Executor simplify developing applications over heterogeneous execution environments.
We developed the Common Analytics Framework to improve operational efficiency and reduce cost. Our framework specifically reduces the application development time and makes it easier to deploy applications in a shorter time considering non-IT experts. In addition, to scale up the business quickly, our framework provides the capability to re-use the existing knowledge of application to solve other closely related problems, thus accelerating the creation of IT x OT solutions.
Thanks to Chetan Gupta, Song Wang, and Kunihiko Harada at Hitachi America, Ltd., Research & Development Division with whom this research work was jointly executed.
*If you would like to find out more about activities at Hitachi India Research & Development, please visit our website.
