19 February 2021

Qiyao Wang
R&D Division, Hitachi America, Ltd.
For many industrial and commercial operations, maintenance accounts for a large part of operating costs. For instance, maintenance costs range from 15% to 60% of the total production costs in manufacturing plants. In the airline industry, the 2014 global spend on maintenance, repair, and overhaul accounted for around 9% of the total operational costs, and this spend is estimated to reach 90 billion dollars in 2024. Even with maintenance cost being such a substantial part of the overall cost, maintenance managers have little visibility into whether maintenance expenditure is money well spent or not, i.e., whether the maintenance is effective or not. In this blog, I’d like to talk about a mathematical formulation of the maintenance effectiveness evaluation problem and a systematic way of solving it.
First, let’s look at the mathematical formulation. To quantitatively evaluate the effectiveness of historical maintenance, we need two data sources:
(a) Sensor data: These are streaming, and historical time series data collected from different sensors of the equipment. Based on the domain expert’s recommendation, data from one or more sensors are used to calculate a Key Performance Indicator (KPI) that reflects the equipment performance targeted by the maintenance. Without loss of generality, we assume that higher KPI values indicate better performance.
(b) Maintenance events: These are discrete timestamped events that represent the maintenance actions that were conducted on the equipment. For each maintenance, we specify 'before maintenance' and 'after maintenance' periods that can be used to estimate whether there is a statistically and practically significant change in equipment performance due to maintenance.*1 To evaluate the effectiveness of a single maintenance action, we proposed the use of statistical hypothesis testing to check whether the true KPI before the maintenance is statistically greater than, smaller than, or equal to the underlying true performance after maintenance.
There are several challenges in solving this problem: (1) The KPIs defined by sensors are typically very sensitive to the changes in load and seasonality. For instance, the KPI MPG (miles per gallon) of a vehicle driving uphill is small regardless of the true performance of the vehicle. (2) It is technically challenging. This is because, on one hand, no test procedures can confirm statistically significant equality. On the other hand, no individual statistical methods can handle more than two hypotheses simultaneously.
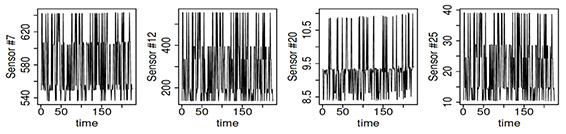
To tackle the first challenge, we proposed a machine learning-based KPI normalization technique to remove the variations due to load and seasonality, as described in Figure 1. Figure 2 demonstrates the results of applying the proposed algorithm in our experiments. It can be observed that raw measurements do not exhibit any trend throughout the life of the equipment while the normalized measurements have an obvious degradation trend.
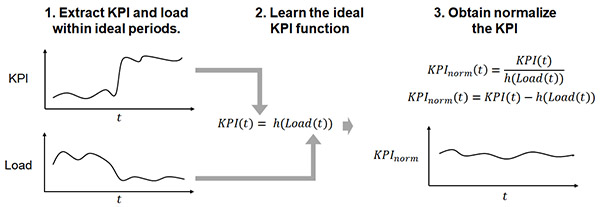
Figure 1: The flow of KPI normalization for removing load as an example
(a) Raw KPIs: Performance is hidden in the raw KPIs due to the confounding operating condition
(b) Normalized KPIs by machine learning: Performance is revealed after removing the effects of the operating condition
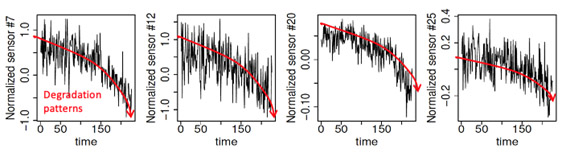
Figure 2: Visualizations of raw KPIs and normalized KPIs in our experiment
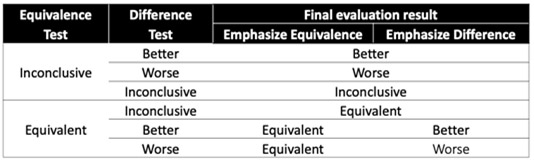
To overcome the second challenge, we proposed a 'difference-equivalence test' to infer the relationship between the population mean KPI before and after the maintenance, i.e., μbefore, μafter. The proposed test consisted of the regular statistical tests (e.g., the t-test, z-test) that can detect statistical difference (i.e., greater or smaller) between |μbefore―μafter| < δ is supported by the data or not.*2 A summary of this overall idea is given in Figure 3. The decision rules of the proposed 'difference-equivalence test' are summarized in Table 1. Note that two different ways of combining the test results are proposed to accommodate different needs in real applications. When the maintenance managers prefer the evaluation algorithm to be sensitive to any size of change in the performance, we recommend using the rule specified by the 'Emphasize difference' column. On the contrary, when the maintenance managers think only changes with a magnitude greater than δ are meaningful, we recommend using the rule specified by the 'Emphasize equivalence' column.
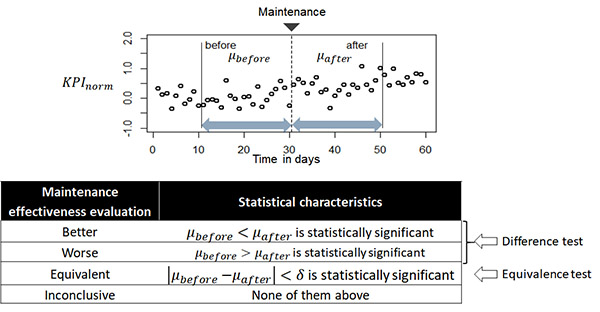
Figure 3: Formulation of effectiveness evaluation for a single maintenance action.
Table 1: Decision rule of maintenance effectiveness evaluation based on the proposed 'difference-equivalence test'.
In practice, the maintenance managers sometimes want to understand the effectiveness of a certain type of maintenance based on multiple maintenance actions. To answer this question, we utilized meta-analysis in statistics to extend the 'difference-equivalence' test discussed above to a set of maintenance actions, as shown in Figure 4.
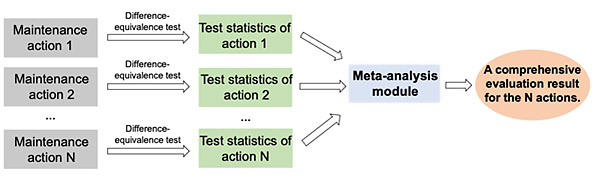
Figure 4: The high-level idea of the proposed maintenance effectiveness for a group of maintenance actions
We conducted numerical experiments on the NASA C-MAPSS data to demonstrate the good performance of our proposed maintenance effectiveness evaluation approach. As shown in Figure 5, the evaluation results for single maintenance actions and groups of maintenance actions are consistent with the ground truth. In particular, our algorithm detected ‘equivalent’ for 97.6% of the instances in the ‘normal’ group and ‘better’ for 94.14% of the instances in the ‘maintenance’ group. For meta-analysis, as shown in the paper, our method claims ‘normal’ for the majority of KPIs for the ‘normal’ group. Similarly, it detected ‘better’ for the majority of KPIs for the ‘maintenance’ group.
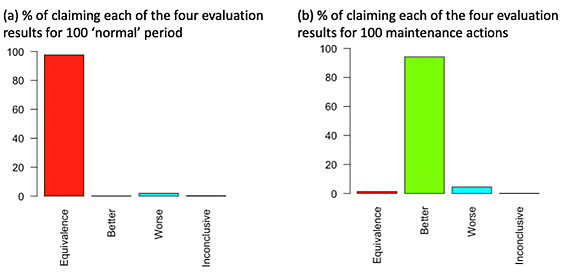
Figure 5: Experimental results using CMAPSS data set
For more details, we encourage you to read our paper [1].
