12 April 2023

Arnab Chakrabarti, PhD, MFE
Research & Development Division
Hitachi America, Ltd.
There is an old joke that God created economists to make weathermen look good. Economists owe their notoriety to one task they are not very good at: forecasting. Notwithstanding its difficulty, predicting significant changes to the economy is valuable. With better forecasts, capital allocation and risk management can be performed with far greater efficiency. Keep in mind also that the knock on weathermen has lost its bluster because weather forecasting has improved considerably with the help of data and supercomputers. Can economic forecasting be similarly improved with data and algorithms? We think the answer is yes, and this article describes our use of deep neural networks to forecast GDP.
In 2018, my colleagues and I in the Financial Innovation Laboratory at Hitachi America, Ltd. trained a neural network, specifically a Long Short-Term Memory (LSTM) model, to predict growth of real GDP. Of particular interest is negative GDP growth, or recession. The model uses features engineered from Leading Economic Indicators (LEIs) as its inputs. The neural network model was able to predict the recessions of 2001-03 following the dotcom bust and the financial crisis of 2008-09. It also predicted a recession in 2020, a conclusion that we presented in Predictive Analytics World in 2019.
A memorable recession happened in 2020, but its cause was COVID-19. A global pandemic would have caused a recession regardless, so evidence from this occurrence cannot be used as proof of the model’s success. Interestingly, the neural network is now predicting another recession in late 2023.
For context, there was unprecedented quantitative easing (see Figure 1) by the US Federal Reserve as part of their efforts to spur the economy by reducing interest rates and increasing the availability of money in the market in 2020-2021.
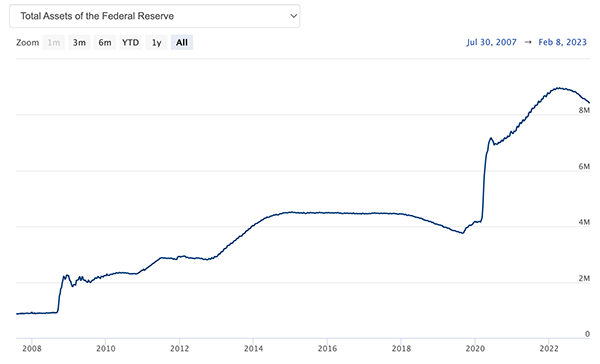
Figure 1. Total assets of the Federal Reserve
(Source: https://www.federalreserve.gov/monetarypolicy/bst_recenttrends.htm)
This also led to inflation, which the central banks were then forced to try and rein in by tightening monetary policy.
One question that is front and center with economic forecasters is whether the Federal Reserve will succeed in ensuring a “soft landing,” meaning will the central bank be able to tame inflation without causing another recession? Our model suggests otherwise.
In this blog, I would like to:
We use the following LEIs, which foretell changes in economic output:
Of these, “(1) Housing starts,” “(3) Domestic investment” and “(5) Retail sales” start to drop before a recession, signifying lower spending due to tightening credit. “(2) Initial unemployment claims” starts to rise as the employment situation worsens. “(4) Corporate profits” starts to drop from their most recent peak. The cost of credit, measured through the spread in “(6) Corporate bond yields,” starts to widen from its recent bottom. The final indicator is “(7) Yield curve,” a vector indicator showing the rates of bonds of different durations. Normally, bonds of longer duration have higher yields, but when the market expects a recession, expected yields of long duration bonds dip below short duration bonds, leading to “inverted” yield curves.
Figure 2 shows yield curves on different dates, all but one of which (in Jan-2011) are inverted. There was no recession after 2011, so that curve is included to show what a normal yield curve looks like. Today’s yield curve (Feb-23) is prominently inverted.
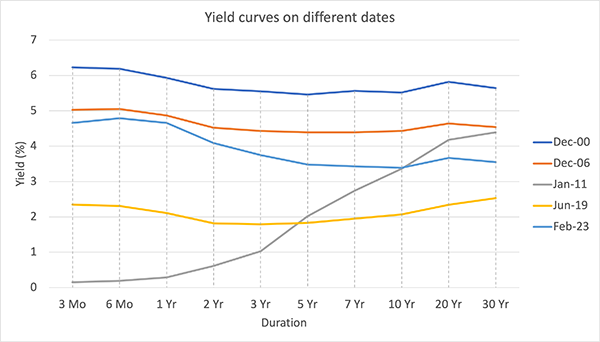
Figure 2. Yield curves on different dates
While “big data” dominates the news, economic data reported daily, weekly, monthly, or quarterly over a few decades is “small data,” insufficient to reliably train a deep neural network. Armed with economic intuition, we construct mathematical artifacts called features derived from LEIs that an LSTM model can reliably learn from.
In many cases, it is the slope of an indicator that is interesting, or in the case of the yield curve, its shape. To illustrate with an example, a drop in “housing starts” suggests tightening credit, which may lead to a recession. Therefore, the slope of the housing starts time series can be a feature whose value turns negative before recessions. Features from other LEIs similarly channel economic intuition. We did not see meaningful added benefit with more sophisticated features such as higher order derivatives.
We found an LSTM with 2 stacked layers of neurons, with 30 units and 1 unit in the layers respectively, to be functional. However, prediction quality improved upon adding an intermediate layer of 10 ReLUs (a Rectified Linear Unit, or ReLU, enables a neural network to model non-linearity). To counter overfitting, which is the problem of overgeneralizing a small set of observations, we employed a technique called dropout.
Our model predicts a recession in late 2023 as shown in Figure 3. The outcome obviously depends on what happens between now and then, but this is what our model predicts subject to some assumptions of continuity of current trends.
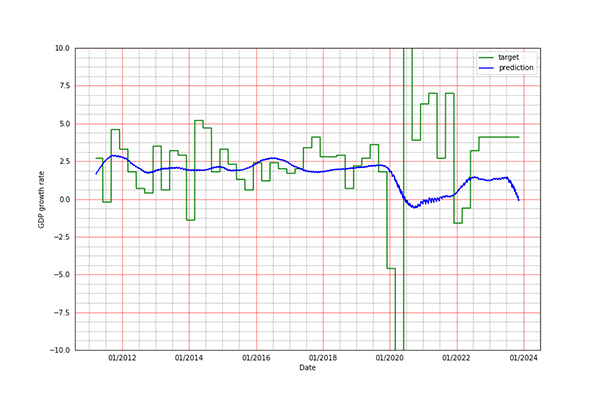
Figure 3. GDP forecast for 2023
Although the model anticipated negative GDP growth in 2020, it could not predict the speed of decline nor the recovery, which is not a surprise given the uniqueness of the events of 2020. Some of the data, such as initial unemployment claims went to levels never recorded before, as shown in Figure 4. The full implications of such drastic changes to inputs are not entirely clear.
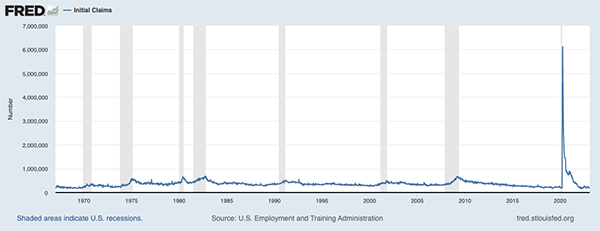
Figure 4. Initial unemployment claims
(Source: https://fred.stlouisfed.org/series/ICSA)
To offer perspective, we present predictions from historical data in Figure 5. The model was late in predicting the 2001 recession, and early in predicting the 2008 bust. This is a trait it shares with economic forecasters, who were also late in 2001, whereas warning sirens had been ringing for almost two years when the economy collapsed in 2008.
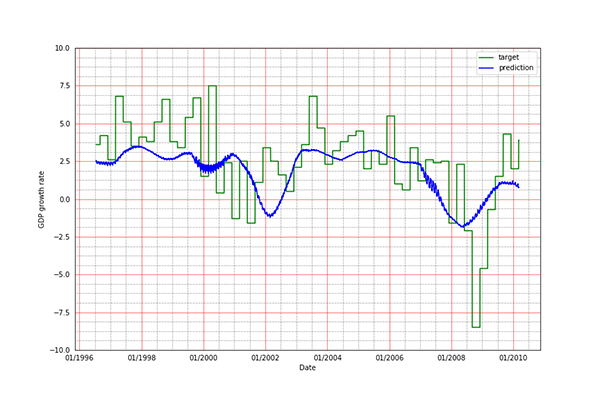
Figure 5. The model's performance in cross-validation
We used mathematically engineered features to train LSTM models that forecast GDP. Our main objective is to predict recessions early, so that there is time to prepare. Had they existed before the great recession, the proposed models would have successfully foreseen it. The way we engineer features from key leading indicators is intuitive and instructive.
The model predicts a recession in late 2023. Our experience suggests that the model may predict a recession early or late, but it is usually not wrong about the occurrence.
I would like to thank David Pinski who encouraged me to pursue this research when he was the manager of the Financial Innovation Lab.
