19 September 2023

Qi XIU
Research & Development Division
Hitachi America, Ltd.
If risk is a symptom of complexity, then modern supply networks carry a plethora of risks. Modern supply chains often consist of multiple tiers. Risk exposure is no longer limited to a company’s direct supplier but extends further to deep-tier suppliers. Many companies simply do not have visibility into risks involving their deep-tier supply network because the suppliers of their suppliers are not deep-tier suppliers. To uncover risks, domain experts need to be equipped with information that allows them to identify deep-tier suppliers.
Early graph neural networks have been applied to supply network data, but these are not as accurate as they could be because they focus only on supplier-buyer relationships and assume each company only produces one type of product. As a result, most companies with various types of products still lack visibility into risks involving deep-tier suppliers.
In this blog, we propose a graph representation learning method that models supply networks as heterogeneous graphs. The benefit of this model is that it can depict multiple relationships between companies and products, thus exposing the deep-tier supplier risk of companies with multiple products.
To validate this model, we applied it to real-world companies producing batteries. Empirical results show that our proposal was able to successfully classify 91.7% of material categories with a precision of 93.3%. As a result, our research indicates that companies with multiple product lines can gain visibility into the risks involving deep-tier suppliers and proactively mitigate hidden risks in their supply networks.
Globalization and the growing complexity of products necessitate increasingly complicated, multi-tier global supply networks. For companies within such supply networks, risk exposure extends far beyond their direct suppliers. For instance, the demand for automotive parts decreased due to the semiconductor shortage, even though most parts don’t use semiconductors. However, the MCU shortage resulted in a motor shortage, requiring automotive makers to halt the production of 7.7 million vehicles [1]. From the perspective of auto parts makers, semiconductor makers are their customers’ tier-three suppliers into which most companies lack transparency. Nevertheless, disruptions affecting deep-tier suppliers can still result in significant economic losses. Therefore, resilience towards risks and disruptions within deep-tier supply networks has become an emerging social challenge.
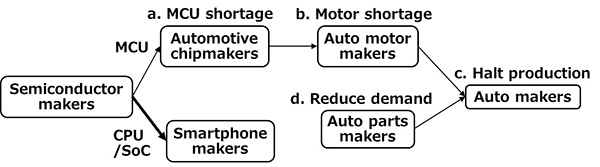
Fig 1. Halt in automotive production caused by semiconductor shortage.
However, most companies lack risk transparency into their deep-tier supply networks because the supplier of their supplier is not a deep-tier supplier. If A is the supplier of B and B is the supplier of C, then A is only the deep tier supplier of C if what A provides B is required for what B provides C. For instance, if a supplier provided both electric motors and internal combustion engines to battery electric vehicles (BEVs) makers and diesel vehicle makers, respectively, the engine parts suppliers would not be the deep-tier supplier of BEVs makers, although they are the supplier of BEVs makers’ supplier.
Researchers have recently made use of Neural Networks to improve existing supply network visibility. For instance, [2] depicts a Graph Neural Network approach for predicting hidden links in a supply network. However, these methods have focused only on ‘supplier-buyer’ relationships by assuming each company only produces one type of product. As a result, companies that produce multiple types of products, — which is the majority of companies — still lack visibility into their deep-tier supplier risk.
To overcome this challenge, we propose a heterogeneous graph representation learning method modeling supply network to visualize deep tier supplier risk. When generating the graph, users first specify the target product or products. Then, all suppliers, of all tiers and types, are recursively traced from logistic data. Thus, the makers of specified products, all suppliers of these makers, and all suppliers of these suppliers, are traced. All goods purchased by these makers, suppliers, and the suppliers of suppliers are extracted as (supplier, good, buyer) triplets. For all triplets extracted, two edges are added to the heterogeneous graph: a production-type edge from supplier to good, and a procurement-type edge from good to buyer. For instance, the heterogeneous graph tracing battery production is generated, as illustrated in Figure 2.
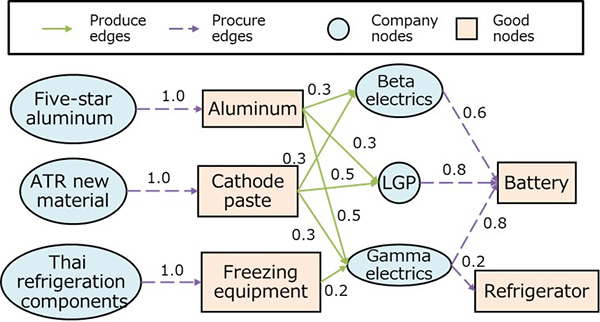
Fig 2. Heterogeneous graph of supply network
In this research, we consider the deep-tier supplier risk visualization as a node classification problem in a heterogeneous graph, where labels are only available for the specified product categories, and all other nodes must be classified accordingly. This problem can be framed as graph-based semi-supervised learning. Specifically, we use Graph Convolutional Network (GUN) as the foundation [3].
We apply the proposal to actual companies producing batteries for validation. In a heterogeneous graph, the company nodes and good nodes have different node types, while production edges from company type nodes to good nodes and procurement edges from good nodes to company nodes have different edge types. As illustrated in Figure 3, the companies and procurement edges are colored blue, while goods and production edges are colored red.
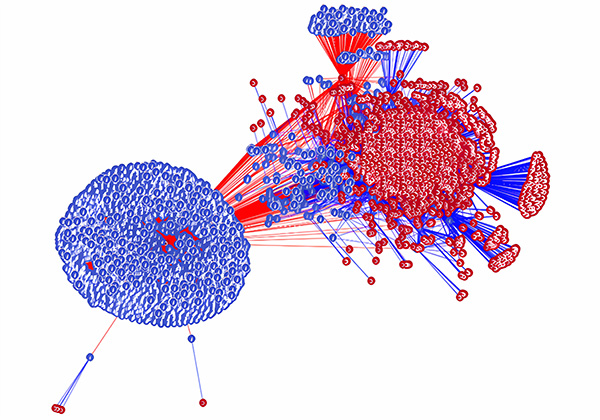
Fig 3. Heterogeneous graph of supply network
The two-tier supply network we constructed consists of the makers of products (battery) and their part suppliers. The supplier-good-buyer triplets for each layer of the supply network are generated to construct a heterogeneous representation of the supply network. Fig. 4 illustrates the resulting classification of the top 30 battery materials using their 6-digit HS codes, and how they can be mapped to the published BOM of battery [4].
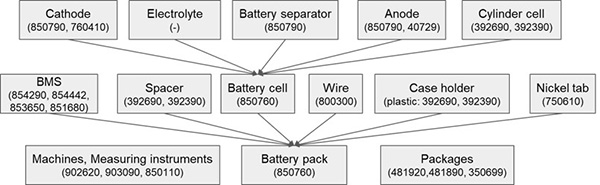
Fig 4. Evaluation result based on published BOM of battery
After evaluation, we successfully classified 91.7% (11/12) of material categories with 93.3% (28/30) precision. In addition to the 12 material categories shown in the published BOM, measuring instruments and packaging materials are also classified as necessary materials.
For companies within increasingly complicated supply networks, risk exposure extends far beyond direct suppliers. However, most companies lack risk transparency into their deep-tier supply networks because the supplier of their supplier is not their deep-tier supplier.
To address the aforementioned issue, we proposed a graph representation learning method which modeled supply networks as a heterogeneous graph. Thus, multiple relationships between companies and products could be simultaneously modeled by a Graph Neural Network visualizing deep-tier supplier risk of companies with multiple products. We validated our proposal by applying it to actual companies producing batteries. Empirical results showed that it was able to successfully classify 91.7% of material categories with 93.3% precision. Using our methods, companies with multiple product lines can realize risk transparency into deep-tier suppliers and proactively mitigate hidden risks in their supply network.
