26 October 2023

Prateek Mital
R&D Centre, Hitachi India Pvt. Ltd.

Chandrasekar Venkatraman
R&D Division, Hitachi America Ltd.
The cost of operation and maintenance of expensive equipment is a serious issue for business owners, so when we look at the high value assets such as wind turbine gear boxes, one of the first questions that comes to mind is, do such multi-million-dollar gear boxes require any special attention? We hardly see gearboxes of modern age cars failing!
Vibration analysis is an effective way to identify defects and is also considered an early and reliable indicator of defects. Such information can help improve asset performance and reduce maintenance downtime.
At Hitachi India R&D, we decided to look at how vibration analysis could be applied in equipment degradation assessment and support preventive maintenance in wind turbines. Firstly, wind turbines are a popular renewable energy source and maintenance & operations of these high value assets are expensive. There are further challenges in the operations of wind turbines as they operate in a remote location and equipment are hoisted at tower as high as 100 meters. Remote monitoring & early fault detection allows wind farm operators to take timely corrective steps and reduce energy and revenue loss. SCADA based monitoring is a standard process for most operators. Secondly, the science behind the vibration analysis of gearbox applies to any rotating equipment and our work can expand to products like pumps, motors etc in industries like automotive, water, energy etc.
Vibration analysis is found vital for early detection of issues in rotating equipment. It enables predictive maintenance and reduces downtime. The comprehensive insight into component’s health improves safety, extends equipment lifespan, and optimizes overall performance.
Overall, vibration analysis is becoming more common place for detecting premature failure across a wide spectrum of assets.
By applying the Fourier Transform to a time-domain signal, it is decomposed into its constituent frequency components. This allows us to examine the presence and magnitude of various frequencies within the signal.
Spectral analysis involves examining the power or amplitude distribution across different frequencies in a signal. This analysis helps to identify dominant frequencies, frequency bands, and any periodic patterns or harmonic relationships present in the signal. The chart shows how various frequencies have elevated amplitudes across the frequency range.
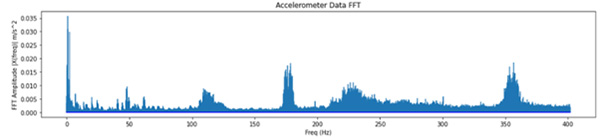
Fig 1. Raw accelerometer data FFT before RPM correction
In the frequency domain, it is possible to apply various types of filters, such as low-pass, high-pass, band-pass, or notch filters, to remove or isolate specific frequency components from a signal. This is particularly useful for noise removal or extracting desired frequency band.
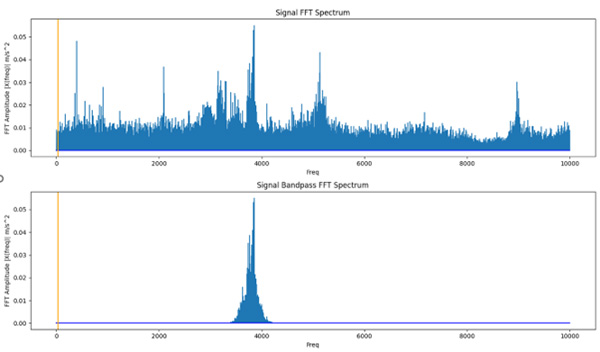
Fig 2. Full spectrum FFT and band pass FFT
A clear frequency band helps to confirm a possible defect. However, in the physical operating environment, the rotation of the equipment is variable to a certain extent, it is important to neutralize the frequency spectrum to variation in the RPM.
Short-Time Fourier Transform (STFT) allows the visualization and measurement of time-varying frequency content, aiding in the understanding of amplitude and phase variations.
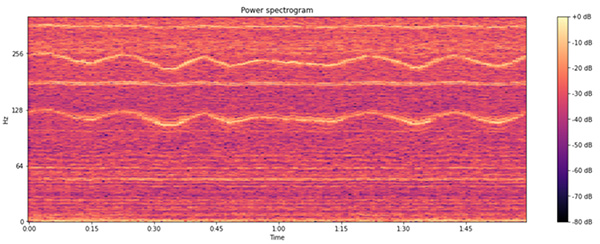
Fig 3. Power spectrogram
By analyzing the frequency spectrum, harmonic analysis can identify harmonics, which are integer multiples of a fundamental frequency. The harmonics reinforce the defect detection and its propagation over time.
Further, envelope analysis is particularly useful in analyzing signals that contain slowly varying components. The chart below shows how a busy signal that hides the inherent slow varying component becomes visible through an envelope analysis.
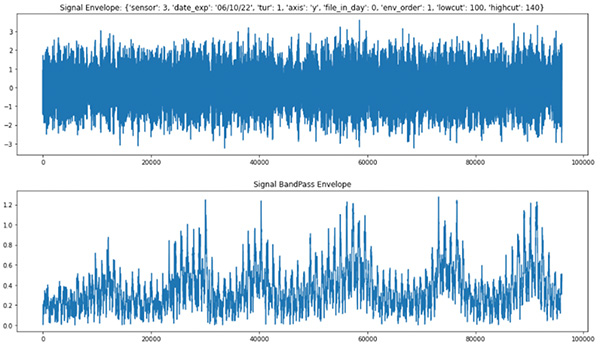
Fig 4. Raw data and FFT with envelop analysis
Physics informed defect frequency calculation helps us correlate the frequencies for various faults.
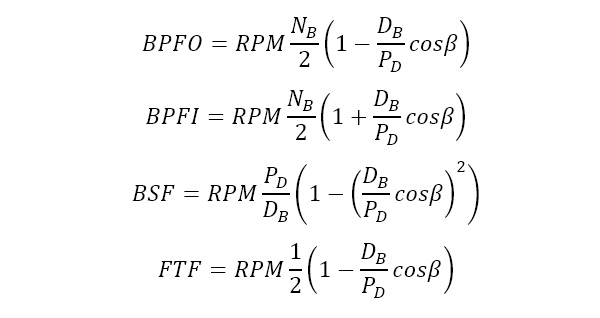
Where,
BPFO = Outer race failing frequency
BPFI = Inner race failing frequency
BSF = Rolling element failing frequency
FTF = Cage failing frequency
RPM = Revolutions per minute of the bearing
PD=(DO+DI)/2, DB is the diameter of balls, DO is the diameter of the outer ring, DI is the diameter of the inner ring, NB is the number of balls, and 𝛽 is the contact angle.
We were able to isolate two specific defects by triangulating the elevated FFT amplitudes and the physics informed defect frequency calculations.
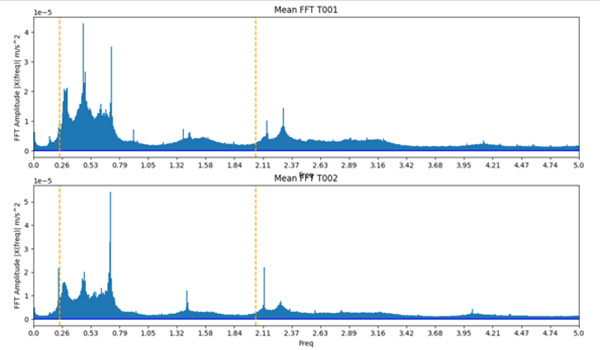
Fig 5. FFT with key fault frequencies
Pictures speak a thousand words, and the spectrogram chart below highlights the elevated amplitudes at specific frequencies with time. This chart is useful to see the trend and understand the impact of degradation or improvement from maintenance.
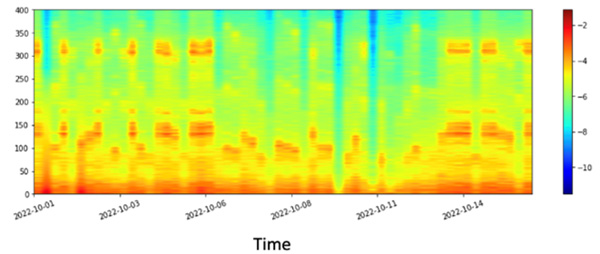
Fig 6. Spectrogram (Amplitude vs. Time)
AI is both ‘Art’ and ‘Science.’ Measuring degradation required deep signal processing skills but also simple artistic way in defining health index.
The systemic degradation of a wind turbine is a very fine measurement, and the ability to measure the extent and trend of degradation over days, month provides valuable insights for multiple use cases.
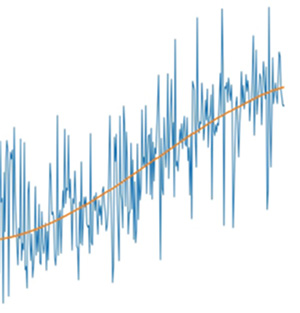
Fig 7. Degradation trend in wind turbine gear box
The chart above shows the trend of degradation that was observed in the wind turbine gearbox used for our evaluation (The scale and magnitude have been removed from the chart for data privacy purpose). However, this chart measures degradation to a tune of a few percentage points over a month period.
A common modern approach is to extract features from both frequency and time domains (e.g., Dominant frequencies and amplitudes from frequency domain, standard deviation, mean, skewness, kurtosis, etc. from time domain) and feed the extracted features into machine learning models and neural networks.
Depending on the use case, supervised or unsupervised algorithms can then be deployed to detect anomalous vibrations and outliers. No wonder, the squeaky noise in any machine needs an upgrade to detect the source of squeaking.
With the cooperation of a wind farm operator, we were able to confirm the results in real world operations and maintenance. The ability to measure the fine degradation in the gearbox over a period of time is a great capability. The analysis using digital signal processing approach highlighted in the blog is a highly effective way to measure deterioration.
The authors would like to acknowledge the contributions to this work from research colleagues at Hitachi India R&D: Vishwaas Narasinh, Swayam Mittal, Nilanjan Chakravortty, and Nikhil Kulkarni.
