4 June 2021

Tsubasa Watanabe
Research & Development Group, Hitachi, Ltd.
Anomalies in manufacturing sensor data can be a warning sign that something is wrong, If these can be caught in real-time, we can prevent defects, breakdowns or accidents and this has become even more so with the advent of mass production. Installation sensors are being added to catch the increasing number of equipment and process anomalies, and machine learning is being applied in anomaly detection.
To contribute to resilient manufacturing systems, reduce loss cost and thus ensure the efficient use of resources, my colleagues and I have been working on a new “systemized anomaly detection” method using sensor data for discrete manufacturing. One challenge that can arise with the combination of additional installation sensors and machine learning is that it can create difficulties in terms of practical deployment. Let me explain the issues that we faced using the example of an actual mass production metal cutting line.
In the metal cutting line, we needed to apply a system that could detect anomalies to eliminate quality defects, but the following problems occurred.
We set out to enable “systemized anomaly detection” including auto parameter tuning by clarifying the proper parameters of waveform processing, feature extraction based on correlation analysis between acquired data, and mass production anomalies. We took the following approach to achieve our goal.
Fig. 1 shows the configuration of the cutting force in the turning cutting process. Each drive motor shown in Fig. 2 represents each cutting force. This approach is practical for mass production and has the potential to reduce the negative influence on the cutting process itself because the current sensor will not touch the cutting chamber directly.
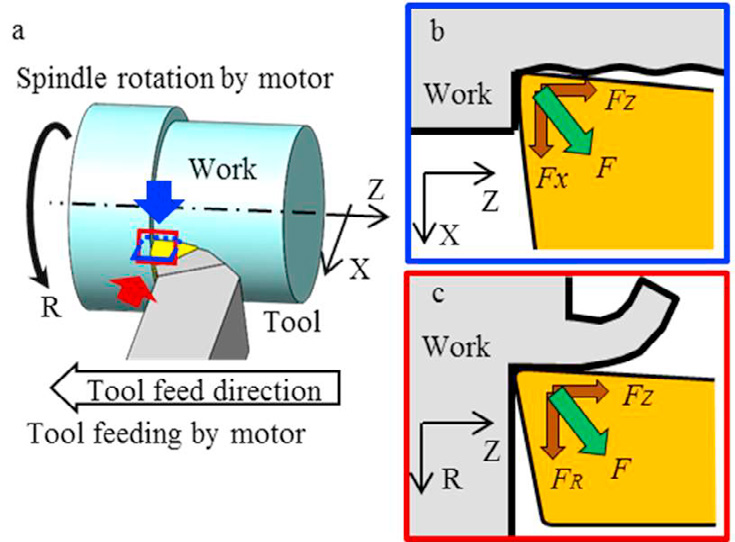
Fig.1 Configuration of turning-cutting-force (F) direction. (a) overview, (b) top view, (c) side view
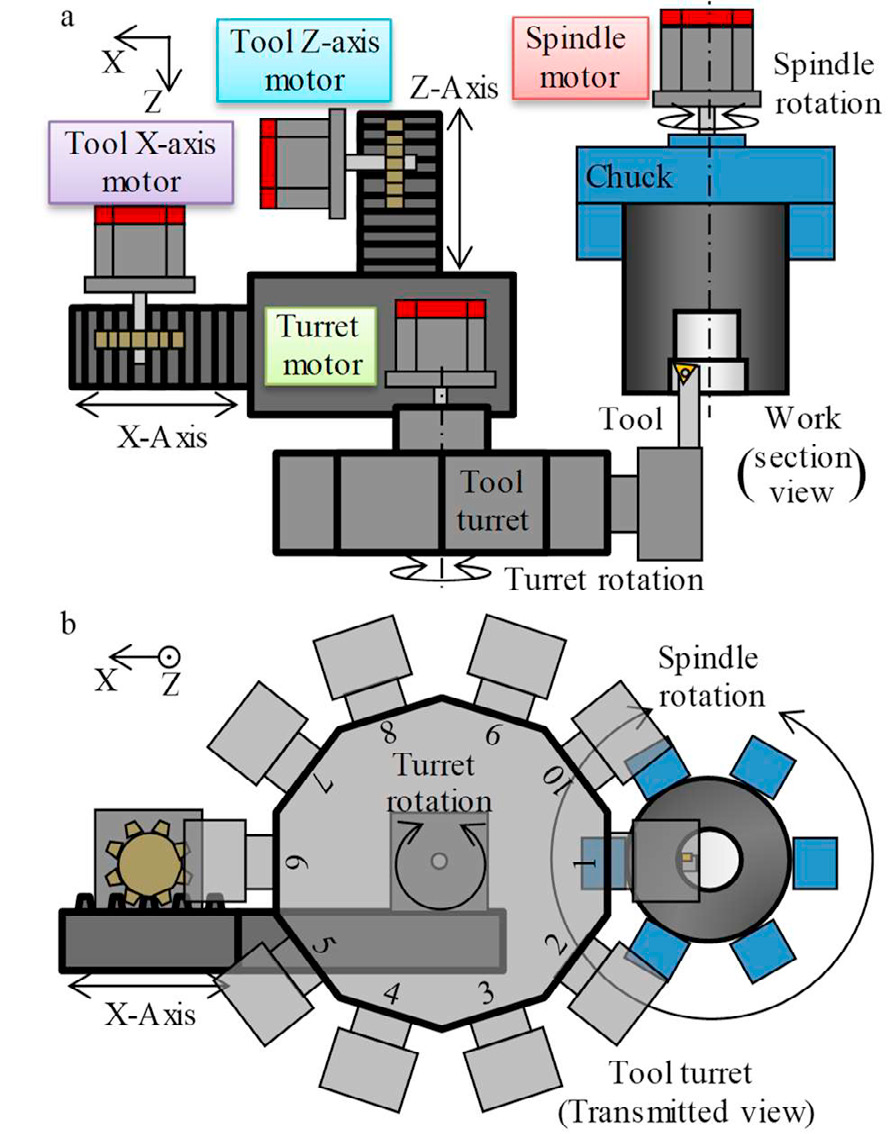
Fig. 2 Configuration of motor: (a) top view and (b) front view
After clarifying the correlation based on cutting process knowledge, we identified the proper waveform processing and feature extraction for obtaining the physical limits of correlation. Table 1 contains three columns for each target anomaly. The first column shows normal and anomaly waveform sets, the second shows an optimized waveform processing procedure for emphasizing the difference between normal and anomaly waveforms, and the third shows the waveform sets after the actual processing using the waveform processing procedure, along with statistics that can be used for anomaly detection. This method, “formalized anomaly detection”, uses optimized statistics to validate the method, which is constructed in Step 3.
Table 1. Formalized waveform processing and statistics combination for anomaly detection
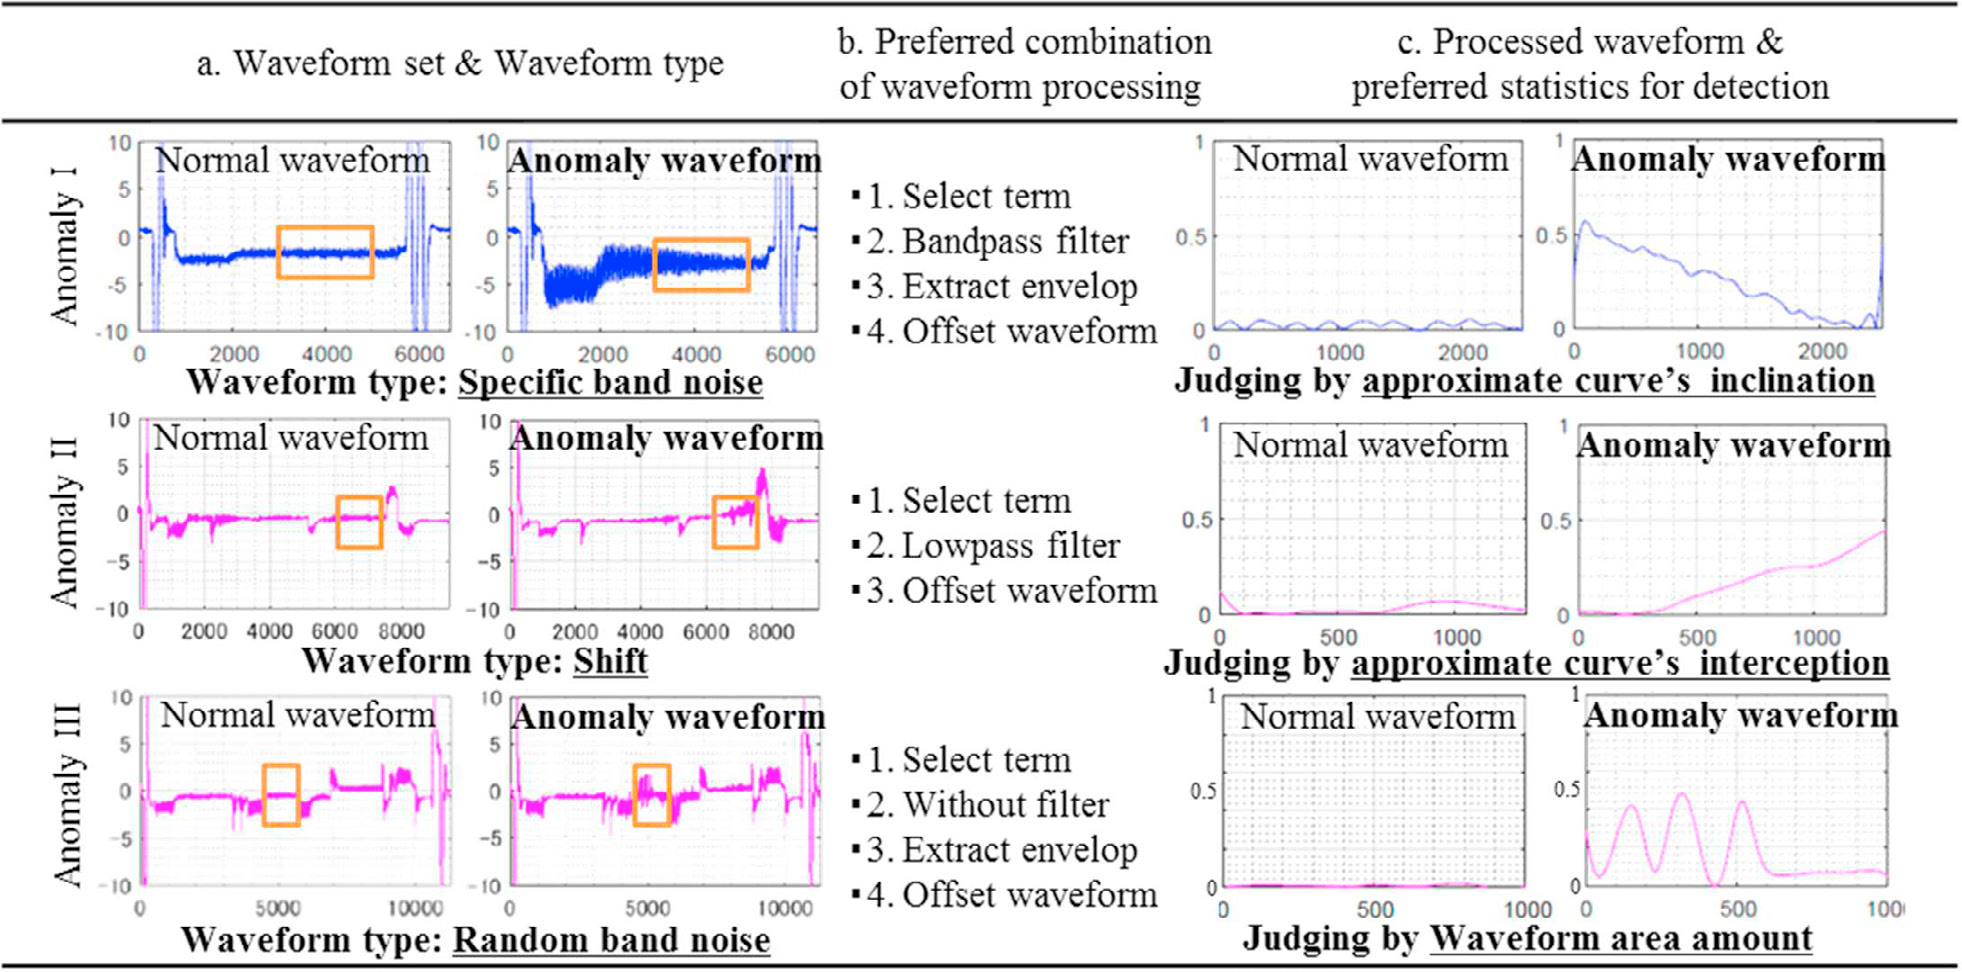
Fig. 3 is a conceptual diagram of how the anomaly detection is systemized using the discretization and pattern-recognition procedure based on the MT method, a conventional pattern recognition method with an auto parameter-tuning function. This “systemized anomaly detection” is then implemented to achieve our goals.
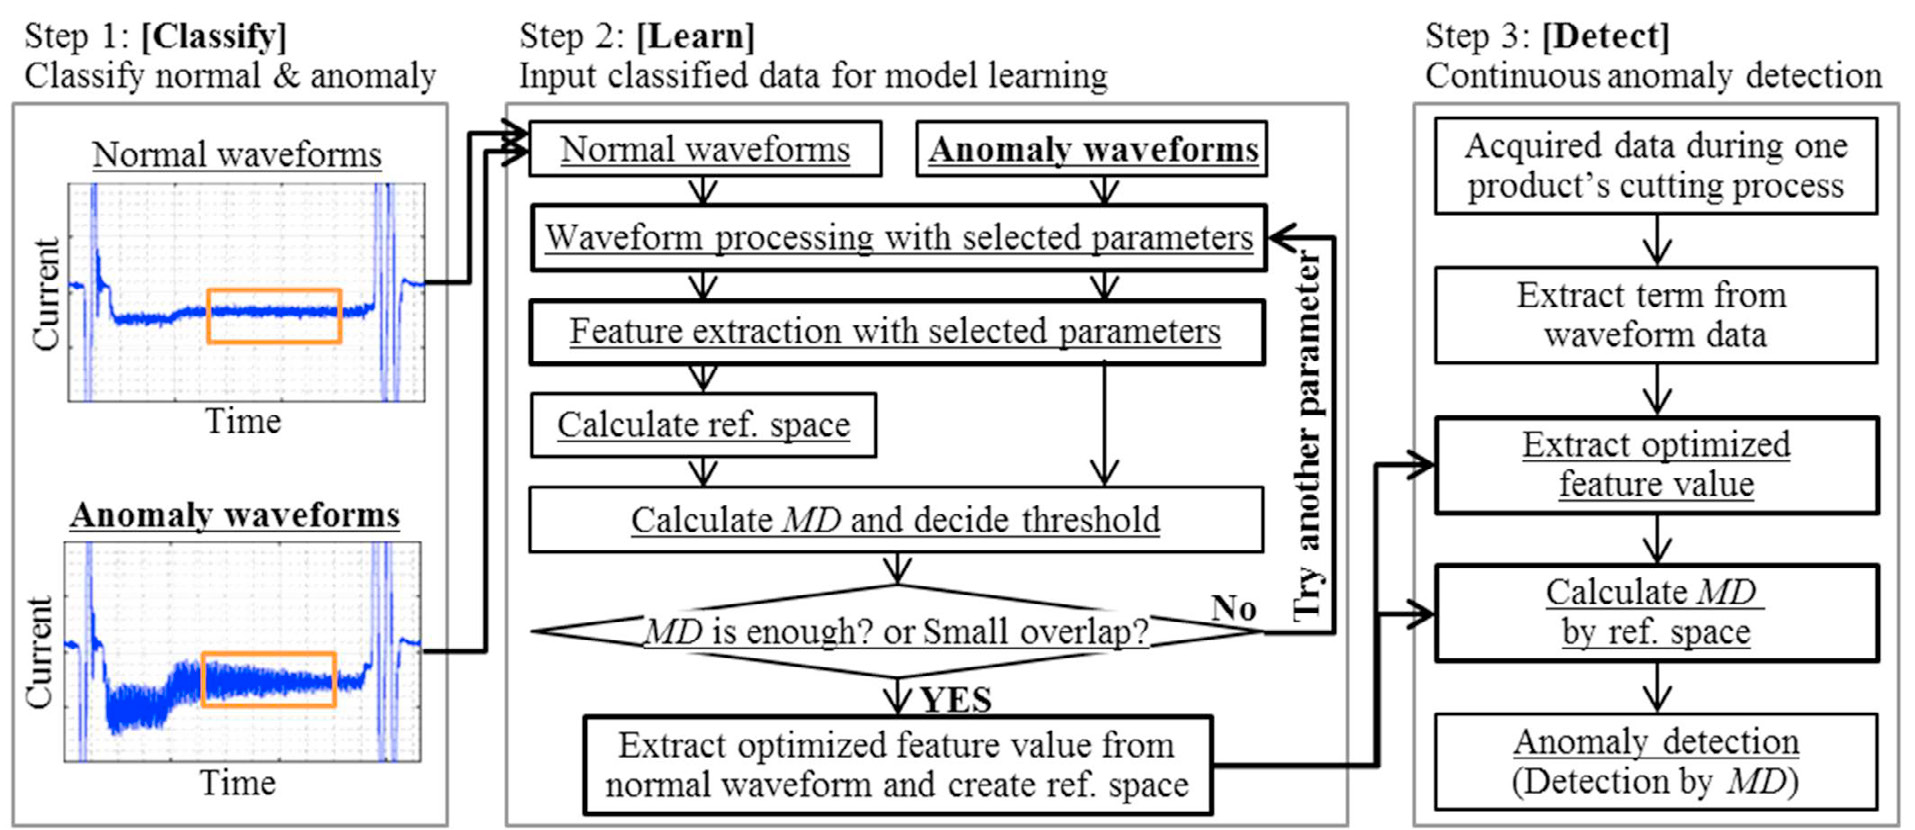
Fig. 3 Systemized flow for pattern recognition without manual parameter selection
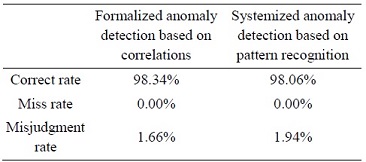
To verify our approach, we applied both anomaly detection methods to a mass production line and achieved 98% accuracy for both, as shown in Table 2. This indicated that the systemized anomaly detection method was optimized well by the cutting knowledge and reached an accuracy comparable to that of the formalized anomaly detection method.
Table 2. Validation results of each method
We plan to apply our method, “systemized anomaly detection," to discrete manufacturing processes other than metal cutting in the future, and therefore break away from manual anomaly detection, to contribute to resilient manufacturing systems.
Our findings are published as part of the 48th SME North America Manufacturing Research Conference (NAMRC48). For more details, please refer to our paper which can be found here .
