There is strong demand from manufacturing sites for the realization of 100% inspection systems to innovate quality traceability and ensure safe and secure products. This article covers the development of a technology capable of contactless, high-speed measurement of 3D shapes on the inner surface of narrow and complex hole shapes (narrow spaces) of components such as the hydraulic parts and engine parts used in automobiles, aircraft, and construction machinery. This technology is one example of a smart factory technology that can be used to realize high-quality manufacturing utilizing IoT sensing. An independently developed long-range, high-accuracy range measurement laser is emitted from the tip of a probe inserted into the narrow space, and the probe is rotated to scan the laser on the inner surface. This enables measurement of inner surface shapes in the range of φ6 to 100 mm to an accuracy of within 5 µm, which was difficult when using a conventional measurement probe. In the future, further development of measurement solutions using this technology and their deployment to manufacturing sites will contribute to the realization of 100% inspection systems for parts with narrow spaces. Furthermore, from the viewpoint of realizing a circular economy, waste will be reduced by increasing productivity through process improvements based on the measurement results, and the technology will also be deployed for quality evaluations prior to the remanufacture of recovered products and parts.


Figure 1 — Overview of a Smart Factory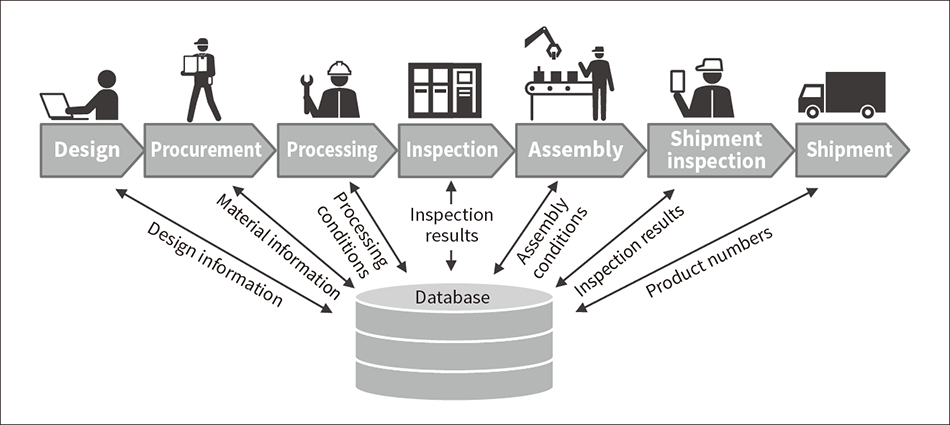 Information from each process is collected via technologies such as Internet of Things (IoT) sensing, and overall optimization is performed by using technologies such as artificial intelligence (AI).
A smart factory uses digital technology such as artificial intelligence (AI) and Internet of Things (IoT) sensing for efficiently manufacturing high-quality, high-added-value products in a short period of time (see Figure 1)(1). Manufacturing sites are facing issues such as a shortage of experienced workers and maintaining reliable quality at overseas production sites. As such, it is necessary to eliminate the reliance on personnel by advancing digitalization to enable products of the same quality to be produced at any site. To do this, it is important to automatically and accurately retrieve three-dimensional (3D) shape data in the inspection and measurement processes for the parts being manufactured, and to utilize this data in controlling the conditions for previous and subsequent processes, and in product quality control(2). However, it is difficult to measure parts that have narrow and complex hole shapes (hereinafter “narrow spaces”). For example, highly accurate machining and measurement is required for parts with flow path surfaces or sliding surfaces that are used inside hydraulic or engine components in automobiles, aircraft, or construction machinery, because the inner surface shapes of their holes are directly related to product performance. However, measuring these holes is difficult when they are narrow spaces.
In response, Hitachi developed a narrow-space 3D shape measurement technology using a laser to measure the shapes of parts with narrow spaces. The characteristics of this technology are: (1) highly accurate measurement can be performed for a wide range of inner diameters (φ6 to 100 mm) with the same probe, and (2) the measurement direction can be switched instantaneously between the side surface direction and depth direction of narrow spaces by switching the polarization of the laser inside the optical system.
This article describes the characteristics and measurement performance evaluation results of the developed technology.
Figure 2 shows an overview of a device that uses the developed narrow-space 3D shape measurement technology(3). The laser-based method used for measuring distance is called the frequency modulated continuous wave (FMCW)(4) method. FMCW measures the distance to the target by changing the laser wavelength during measurement and calculating the amount of change in the wavelength of the laser that is reflected back from the target. At this time, a proprietary correction is applied that takes into account unevenness in the change speed of the wavelength and sensitivity fluctuations due to temperature changes, delivering highly accurate distance measurements over a wide range. This ranging technology enables measurement of inner surfaces over a wide range of φ6 to 100 mm with the same probe(5).
Figure 2 — Overview of Narrow-space Shape Measurement Device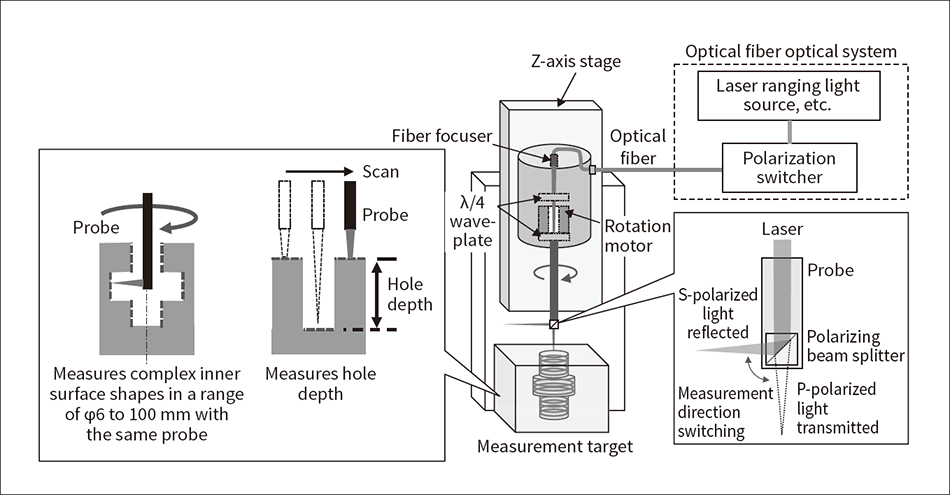 The light guided from laser ranging is emitted from the probe tip and the distance to the measurement target is measured. The polarization is controlled by the polarization switcher to switch the measurement direction between the side surface direction and the depth direction.
Figure 3 — Principle of Switching Laser Irradiation Direction Using Polarization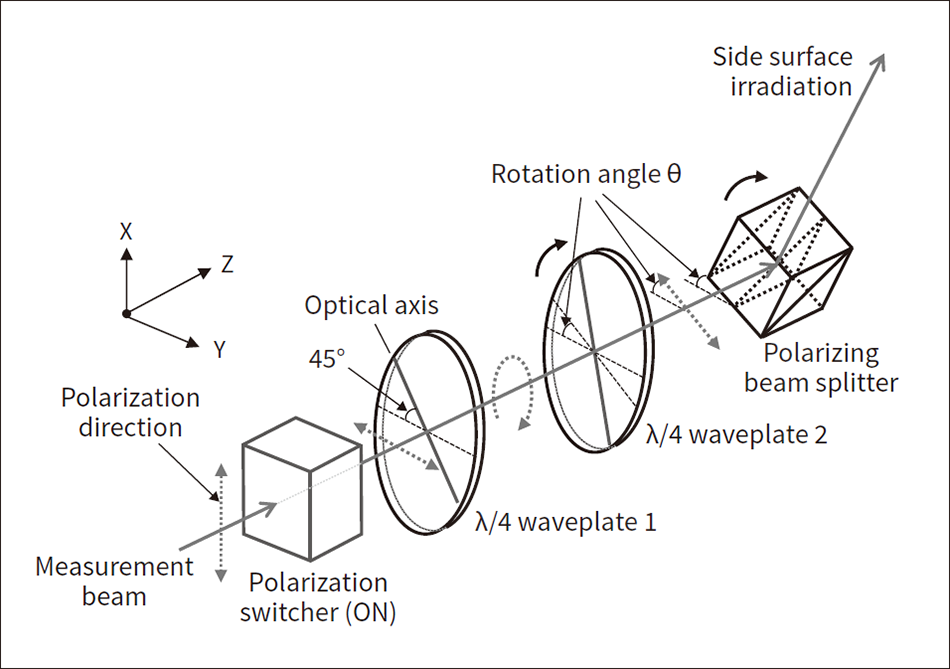 A polarization switcher, two λ/4 waveplates, and a polarizing beam splitter can be used to switch the ranging laser irradiation direction between the side surface direction and the depth direction.
Figure 4 — Developed Narrow-space Shape Measurement Device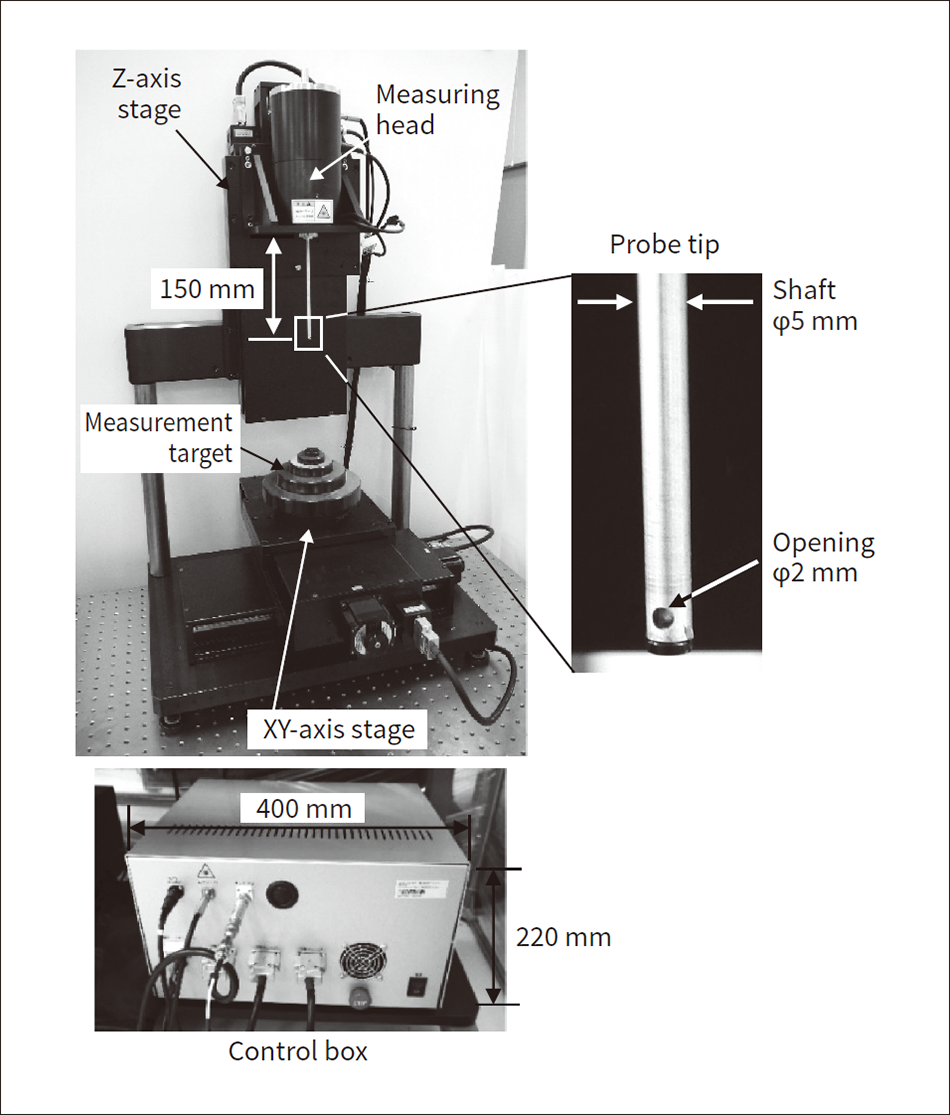 The diameter dimension and inner surface shape of the target can be measured by installing the measurement target on the XY-axis stage and scanning the measuring head mounted on the Z-axis stage in the Z-axis direction.
Furthermore, in some cases there is a need to measure narrow spaces not only in the side surface direction of the hole, but also in the depth direction. In response, Hitachi developed a technology that enables measurement in both directions with the same probe. The polarization of the light generated by the laser ranging system is controlled by the polarization switcher to switch the measurement mode between the side surface direction and the depth direction. The probe is inserted into the target space, and in the measurement mode for the side surface direction, the inner surface shape of one cross section is measured while rotating the probe, then by further scanning the probe in the Z direction, an overall 3D shape of the target inner surface can be obtained. In the measurement mode for the depth direction, the probe scans horizontally to enable measurements such as the target hole depth(6).
Figure 3 shows details of the switching method for the light irradiation direction using polarization. The polarizing beam splitter at the tip of the probe has the property of transmitting light that oscillates parallel to the incident surface (P-polarized light) and reflecting light that oscillates perpendicular to the incident surface (S-polarized light). Therefore, the control of the polarization switcher that electrically switches the polarization of the ranging laser between P-polarized light and S-polarized light can be used to switch the ranging laser irradiation direction between the side surface direction and the depth direction.
At this time, to rotate the measurement beam while keeping it facing the side surface direction, the polarization direction of the incident light must be rotated in accordance with the rotation of the polarizing beam splitter to maintain a constant polarization condition relative to the polarizing beam splitter. To do this, two λ/4 waveplates are used. The axis of the first λ/4 waveplate is positioned at 45 degrees to the polarization direction of the incident light, which converts the linear polarization into circular polarization. The second λ/4 waveplate and the polarizing beam splitter rotate together with the rotation motor. When the circular polarization passes through the second λ/4 waveplate, it is reconverted to linear polarization, always maintaining a constant polarization incident direction relative to the polarizing beam splitter as the motor rotates. As a result, the beam is rotated while facing the side surface.
Figure 4 shows a device developed based on this technology. The ranging light source is installed in the control box and light is guided up to the measuring head by an optical fiber. The measurement range of the ranging light source is 300 mm and the measurement speed is 10,000 points/second (10 kHz). The measurement probe has a length of 150 mm and diameter of φ5 mm, and light is emitted from the aperture at the tip. To support major machined parts, the in-focus range of the irradiated beam is designed to be 50 mm from the emission position, which covers φ6 to 100 mm when converted to diameter.
If this lens design is changed so that the in-focus range is 300 mm from the emission position, measurement will be possible up to a diameter twice the maximum measurement range of the ranging light source (600 mm). By mounting the measurement target on the XY-axis stage and scanning the probe in the Z-axis direction, the diameter dimension and inner shape of the target can be measured. The target diameter measurement accuracy is 5 µm (2σ).
Figure 5 — Performance Evaluation for Developed Ranging System Using a Laser Interferometer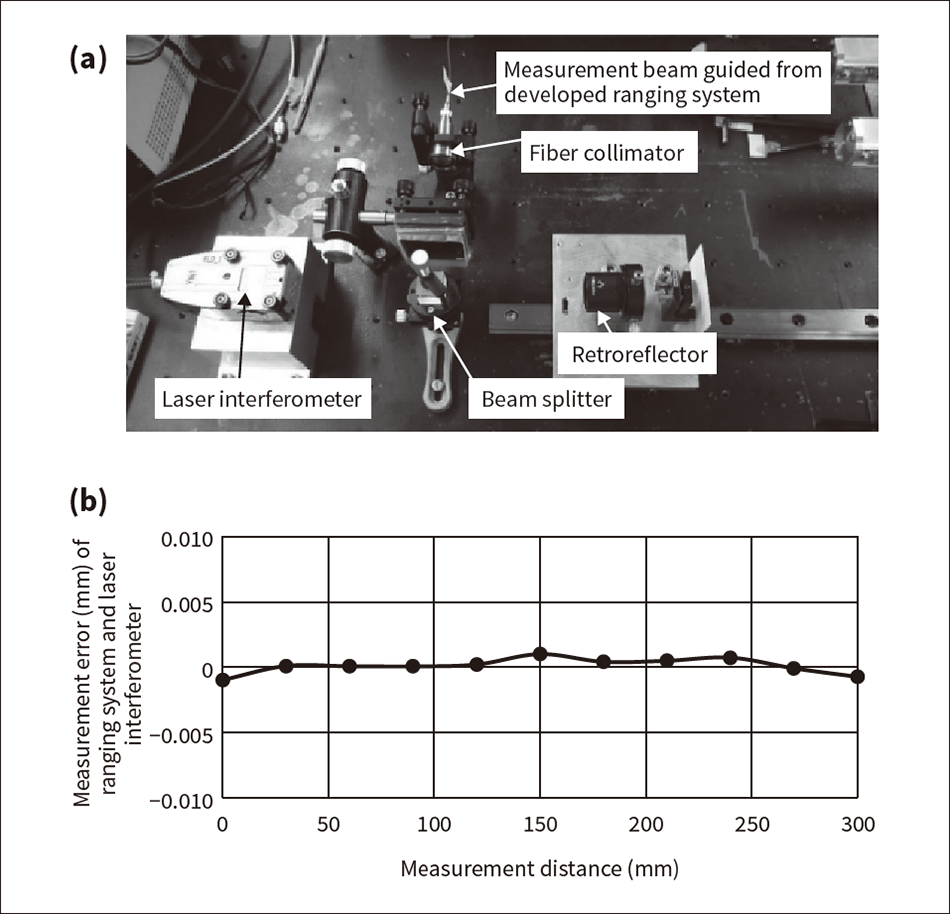 The evaluation configuration (a) and evaluation results (b) are shown.
First, the measurement performance of the developed ranging system was evaluated using a laser interferometer. Figure 5 (a) shows the evaluation configuration. Although the laser interferometer cannot measure the absolute position, it can perform highly accurate measurement of the relative movement amount while the target is moved. This measurement accuracy is within ±0.1 µm. The light from the ranging system is emitted into the space by the fiber collimator, and is then irradiated onto the retroreflector installed on the linear guide after combined with the light of the laser interferometer along the same light path by the beam splitter. The light returning from the retroreflector is measured, and while continuously changing the distance of the retroreflector, ranging values between the laser interferometer and the ranging system are compared. Figure 5 (b) shows these evaluation results. The horizontal axis indicates the measurement distance, and the vertical axis indicates the distance error of the ranging system when the laser interferometer is taken to be the true value. The evaluation results demonstrated that across a distance of 300 mm, the error compared to the laser interferometer is within ±1 µm.
Next, the accuracy of inner diameter measurement was evaluated using the measurement probe. Figure 6 (a) shows the evaluation configuration. Ring gauges with diameters certified at φ6, 16, 30, 60, and 100 mm were used in the evaluation. Measurement was performed 10 times for each ring gauge, and the average of these values and the deviation (2σ) were evaluated. However, note that the values stamped on the ring gauges were certified at 20°C, but the temperature of the laboratory was 23.5°C. Therefore, the values were temperature-corrected to 20°C equivalent size for comparison. Figure 6 (b) shows these evaluation results. The horizontal axis indicates the diameter of the ring gauges, and the vertical axis indicates the deviation between the ring gauge stamped values and the measured values. The black dots indicate the average values of 10 measurements, and the error bars indicate the measurement deviation (2σ). The evaluation results demonstrated maximum error of 0.8 µm, and that the target measurement accuracy for the diameter was within ±5 µm for ring gauges from φ6 to 100 mm.
In addition, the accuracy of depth direction measurement was evaluated using the measurement probe. Figure 7 (a) shows the evaluation configuration. Block gauges with certified thicknesses were used in the evaluation. The polished surface of a block gauge was joined to another block gauge by wringing, and the distance to the polished surface on the upper surface of the block gauge was measured. Next, the X stage was scanned to measure the distance to the polished surface of the other block gauge, thereby measuring the height of the block gauge. The block gauges used for the evaluation were 2, 15, 25, and 47 mm. The height was calculated from the difference in the average values of the measurements (1,000 points) within 100 ms for both the upper surface and lower surface of each block gauge. The same measurements were performed 10 times, and the average and deviation (2σ) of these values were evaluated. Figure 7 (b) shows these evaluation results. The horizontal axis indicates the block gauge thickness, and the vertical axis indicates the deviation between the block gauge thickness and the measured values. The black dots indicate the average values of 10 measurements, and the error bars indicate the measurement deviation (2σ). The evaluation results demonstrated maximum error of 2.4 µm.
Figure 6 — Accuracy Evaluation for Inner Diameter Measurement Using Ring Gauges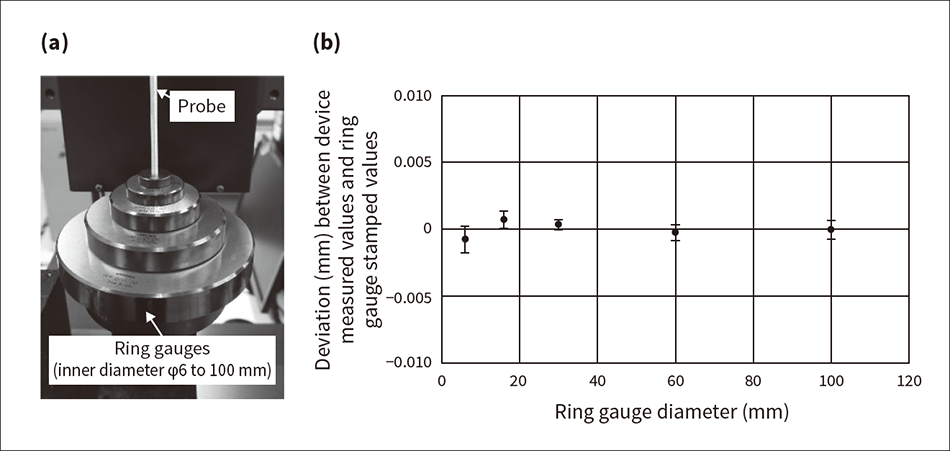 The evaluation configuration (a) and evaluation results (b) are shown.
Figure 7 — Accuracy Evaluation for Depth Direction Measurement Using Block Gauges The evaluation configuration (a) and evaluation results (b) are shown.
Figure 8 — Example of Shape Measurement Using Developed Narrow-space Shape Measurement Device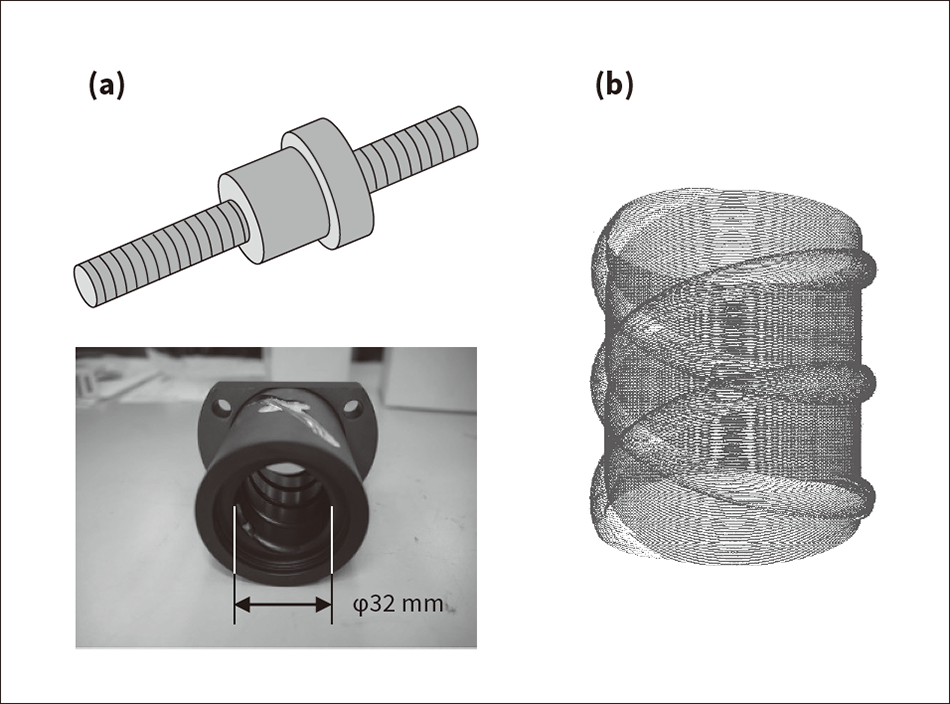 The exterior appearance of the ball screw used as the measurement target is shown in (a) and the measurement results are shown in (b).
Next, 3D shape measurement was demonstrated using the developed narrow-space shape measurement device. A ball screw nut with a groove on the cylinder inner surface was set as the measurement target [see Figure 8 (a)]. The measurement probe was inserted into the inner surface of the ball screw, and the cross sections were measured while scanning the Z-axis stage to obtain the 3D shape of the inner surface. Figure 8 (b) shows these measurement results. This demonstrated that by using the developed narrow-space shape measurement device, it was possible not only to measure the cylindrical part of the ball screw, but also the complex shape of the groove.
This article described a narrow-space 3D shape measurement technology using a long-range high-accuracy measurement laser. In the future, further development of measurement solutions using this technology and their deployment to realize 100% inspection systems for parts with narrow spaces will contribute to quality traceability innovation, and safe and secure products.
Additional actions to be considered in the future include feeding back the measurement results into process improvements to improve productivity and reduce waste, and measuring and testing the deterioration of recovered products and parts for optimization of remanufacturing processes based on quality evaluations and measurement result. Such measurement solutions will contribute to the realization of a circular economy.
