Featured customer case
Lumada customer case code: UC-00939S
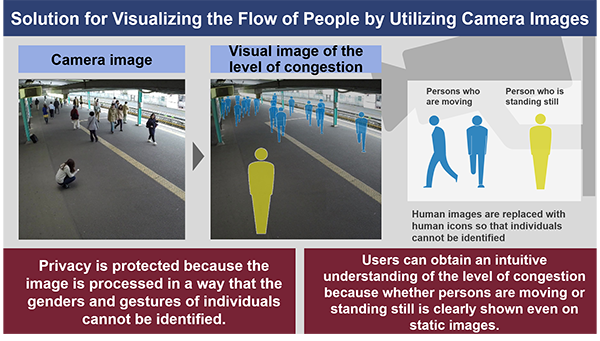
Solution for Visualizing the Flow of People by Utilizing Camera Images
2021-07-30

In the COVID-19 pandemic, people need to avoid the 3 Cs (closed spaces, crowded places, and close-contact settings).
The solution for visualizing the flow of people combines already installed cameras with Hitachi’s technology to make visible the level of congestion at facilities in real time. This solution helps people avoid the 3 Cs.
The level of congestion can be made visible by using images acquired by existing cameras. The images are processed so that individuals cannot be identified and privacy is protected, and at the same time, users can obtain an intuitive understanding of the level of congestion. By using real time information provided through smartphone applications, this solution improves safety and convenience for users, and contributes to the formulation of measures to reduce congestion at public transportation companies.
Collaborative creation with Lumada! Understand the level of congestion while protecting privacy.
Many people use trains every day as their means of public transport. If transport delays or bad weather greatly disrupt the train schedule, railway stations become overcrowded. This situation forces people into 3 C situations, which increases the risk of catching infectious diseases such as COVID-19.
Public transportation companies want to prevent the spread of infections in crowded stations, and so the companies want to inform customers of the level of congestion at stations before the customer heads for the station. The companies particularly want such measures in the midst of the current COVID-19 pandemic.
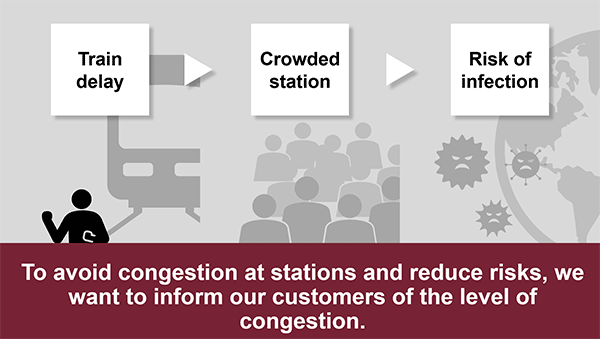
Public transportation companies want to formulate congestion-reduction measures to reduce risks. Providing visual and real-time information on the level of congestion at stations via smartphone applications can resolve such issues. At the same time, this can improve safety and convenience for users.
One of Lumada’s solutions, the Solution for Visualizing the Flow of People by Utilizing Camera Images, uses images acquired by existing cameras at stations to make the level of congestion visible (“data visualization”). The solution provides images in which individuals cannot be identified. Images are updated every minute, so station users can obtain information about the level of congestion in real time.
In addition, data for analyzing the level of congestion in the past is aggregated on a daily or hourly basis, and provided as statistics on congestion trends. Both public transportation companies and station users are able to check congestion trends in graphs.
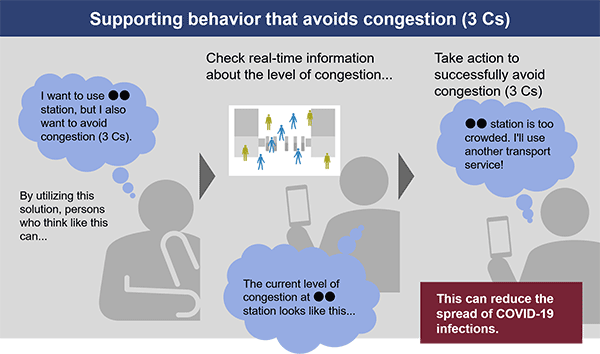
Congestion information is provided via smartphone applications, so that station users can check the level of congestion before leaving for the station. If a station is extremely crowded or the train schedule is disrupted, station users can use other means of transport or choose another route. This allows people to avoid the 3 Cs. In addition, the transportation company can reduce congestion by using applications to guide users to safe places. This solution is expected to be effective in reducing the spread of COVID-19.
Effectively utilizing existing assets
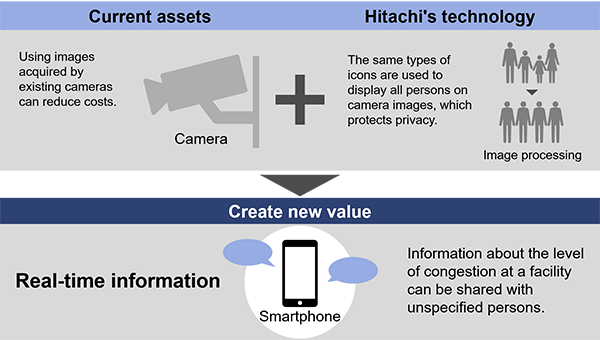
This solution for visualizing the flow of people uses camera images acquired by existing cameras to make visible the level of congestion at facilities. This solution can provide real time information via smart phone applications.
This solution uses images acquired by cameras that are already installed at a station. No dedicated sensors or beacons (devices that receive radio waves) are required, so current assets can be used effectively. This reduces the cost of implementing this solution.
Hitachi’s image processing technology replaces the images of persons acquired by existing cameras with human icons, so that the individuals cannot be identified. Features of a person, such as their gender, whether the person is standing or sitting, and whether the person is in a wheelchair, cannot be identified. Information indicating whether a person is moving and the direction of the movement is presented by icons. This protects privacy while enabling users to obtain an intuitive understanding of the level of congestion.
Because privacy is protected, such information can also be sent to unspecified persons through smartphone applications.
On November 7 and 8, 2020, we conducted technical tests*1 of our solution for visualizing the flow of people at official professional baseball games*2 held at Tokyo Dome (Bunkyo-ku, Tokyo). This was one of the measures for preventing the spread of the COVID-19 inside and outside the facility and for protecting user privacy.
To understand and analyze the level of congestion at the facility, the technical tests did the following:
The results of these technical tests will be used in the future to formulate measures to prevent infection, to reduce congestion, and to provide guidance measures in sport events.
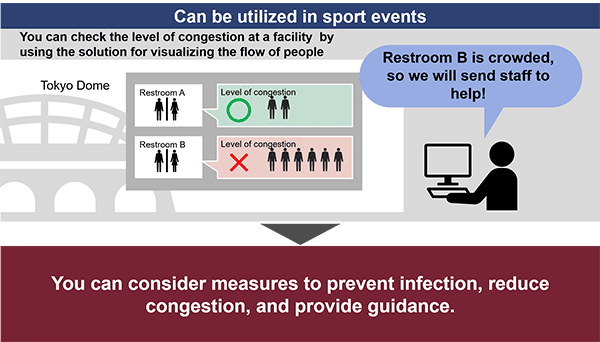
Based on the technical tests performed at Tokyo Dome, Hitachi is considering using the solution for visualizing the flow of people to reduce congestion and control infection at facilities where people gather. This solution has already been implemented in public transportation companies to reduce congestion.
In addition to being an anti-COVID-19 measure, which is a requirement in various industries, this solution can make wide-ranging contributions to the optimization of urban development: for example, for the reduction of congestion at facilities, traffic guidance, tourism, and disaster prevention.
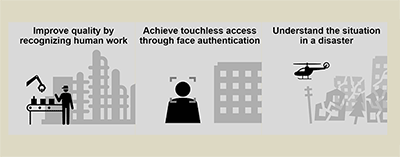
In addition to using AI image analysis to reduce congestion based on people-flow analysis, the Hitachi Group is using AI image analysis in various areas. For example, such analysis is used to improve quality by recognizing human work, to achieve touchless access through face authentication, and to understand the situation during disasters.
Please take this opportunity to learn more.
For details about solutions, visit here.
The level of congestion can be made visible by using images acquired by existing cameras. The images are processed so that individuals cannot be identified and privacy is protected. At the same time, users can obtain an intuitive understanding of the level of congestion. By using real time information provided through smartphone applications, this solution improves safety and convenience for users, and contributes to the formulation of measures to reduce congestion at public transportation companies.
