Featured customer case
Lumada customer case code: UC-01776S
Solving problems at manufacturing sites with the manufacturing dashboard
2021-11-30
Improving productivity at manufacturing sites is an extremely important issue when considering management improvements in the manufacturing industry. This article introduces Lumada’s manufacturing dashboard for real-time monitoring of manufacturing-line equipment, which helps improve productivity and efficiency at manufacturing sites.
Real-time information from manufacturing sites can be used to optimize the entire manufacturing site. In addition to enabling automation of manufacturing processes, the information can be used for procurement of materials and parts, quality control, and product shipment. The information supports quick decision-making based on KPIs in a variety of fields including food and chemistry.
Co-creation with Lumada! Supporting optimization of the entire production process
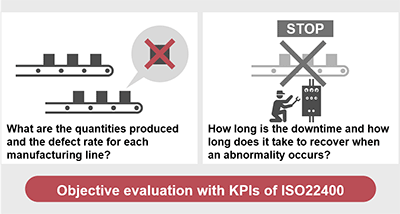
In order to respond flexibly to changing market environments, we need to understand problems at manufacturing sites in real time and resolve them swiftly.
When a customer considers purchasing a product, in addition to the quality and price of the product, the lead time (the period of time until the product is delivered) is an important factor. To shorten the lead time for manufacturing and improve productivity, supervisors at a manufacturing site must be able to understand the state of manufacturing-line equipment and maintain normal operating conditions.
However, if a supervisor manages multiple manufacturing sites and an abnormality occurs at one site, the supervisor usually needs to go to that site to investigate the cause, identify the problem, and then take action to recover the system. During this time, the supervisor cannot monitor the state of other manufacturing-line equipment or other manufacturing sites at other locations. Therefore, if another failure occurs in manufacturing-line equipment, it will take time to investigate what happened and where. This can result in prolonged manufacturing downtime and reduced productivity.
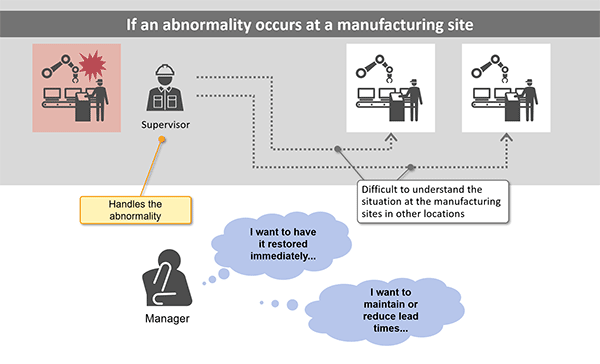
If an abnormality occurs in manufacturing-line equipment, production quantities and quality might decrease because production of parts stops, products cannot be assembled, products cannot be shipped, and delivery is delayed. In particular, if manufacturing-line equipment stops when many models are being produced in small quantities, complicated production plans will need to be adjusted, which significantly impacts productivity.
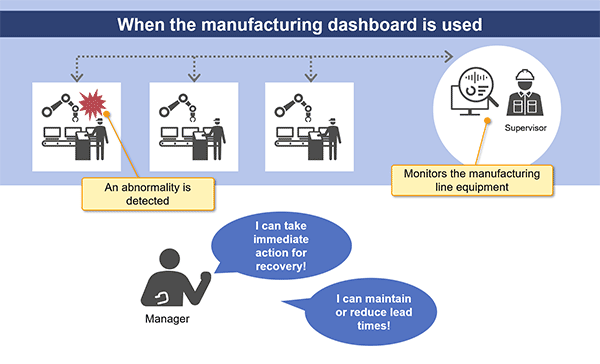
With Lumada’s manufacturing dashboard for real-time monitoring of manufacturing-line equipment, the state of the entire manufacturing site is displayed in real time, and countermeasures are displayed if an abnormality occurs. The dashboard helps customers who want to maintain or improve production volume and quality.
In addition, since the dashboard allows you to check the manufacturing status of each product, you can understand trends in changes in the manufacturing status and thereby identify the cause of failures and take countermeasures before they occur. Compared to situations in which supervisors and workers respond to abnormalities only after they occur, the dashboard enables proactive responses, which reduce manufacturing-line downtimes and thereby enables lead times to be maintained or shortened. As a result, this creates new value that leads to improved productivity.
Intuitive and easy to understand screen for checking manufacturing sites
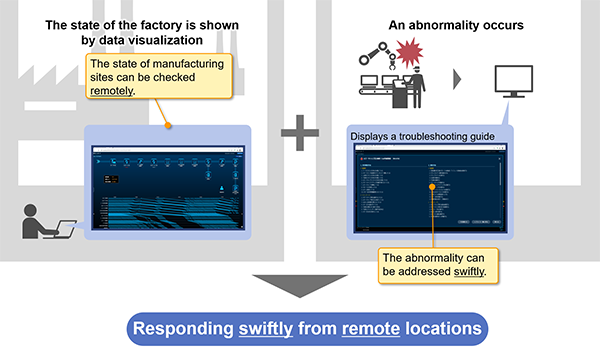
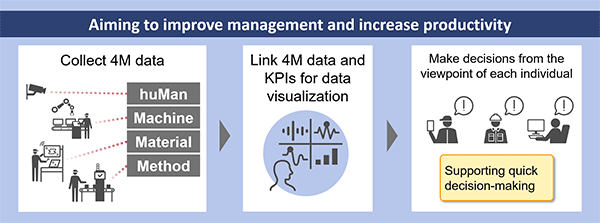
The manufacturing dashboard for real-time monitoring of manufacturing-line equipment utilizes 4M data collected from camera images at manufacturing sites. By using processing time as a common axis and providing data visualization in a unified manner, you can remotely provide management of manufacturing sites swiftly.
In order to improve the productivity of a manufacturing site, we need to understand the current state of the entire manufacturing site and evaluate it objectively.
Implementation of KPIs defined by ISO22400 enable data from manufacturing sites to be evaluated and visualized by standardized indicators, and enables the current state to be understood in a fair manner. The benefits of standardization include the following:
In transactions of companies which implement ISO22400 KPIs, some companies include terms and conditions that the counterparty must implement ISO22400 KPIs, to avoid creating new KPIs.
So far, we have described some benefits of introducing the manufacturing dashboard, which supports productivity improvements at manufacturing sites by utilizing 4M data, and have described some of its functions. Note that 4M data can be utilized to improve management. Here, we will describe management and the manufacturing dashboard and provide actual examples.
Continuous improvement of manufacturing sites from awareness of management and manufacturing
The market environment in the manufacturing industry is constantly changing as customer needs diversify, global competition intensifies, and digitalization progresses. In order to respond to these changes, a management system that can identify and solve problems at management and manufacturing sites is required.
The management and manufacturing dashboard provides data visualization of KPIs ranging from management information to the status of manufacturing sites. The data is visualized in a unified manner to support quick decision-making. Specifically, by linking 4M data of the manufacturing site to KPIs, the dashboard displays information in a quantitative and timely manner in graphs that are useful when considering measures for improving management and productivity.
The management team can use the dashboard to check KPIs such as sales, profit margins, cash flow, and the availability rate for each office and factory. This enables the management team to understand, in real time, whether the management KPIs are being achieved. The team can then use these results to improve management.
In addition, factory managers and line supervisors can consider measures to improve productivity based on information such as production volume and manufacturing operation conditions at the manufacturing sites they manage.
Furthermore, by using the expertise that Hitachi has cultivated through co-creation with customers, standard dashboard screen components, and templates, we can provide customized dashboards that match the customer’s needs in a short time.
The following shows an application to onsite responses linked to upper-level KPIs.
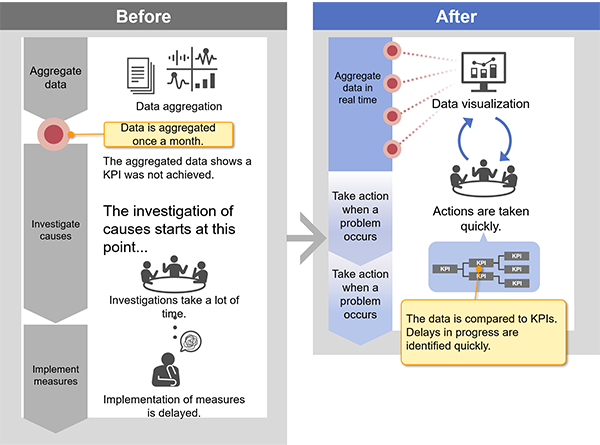
When KPI-related data is aggregated on a monthly basis, you can only check the achievement status of KPIs once a month when the data is aggregated. If the aggregated monthly data reveals that a KPI was not achieved, investigating the cause at this point can result in delayed identification of the problem and can cause delays in the implementation of countermeasures.
The management and manufacturing dashboard automatically aggregates data related to management KPIs in real time and improves understanding by data visualization. Any delays in achieving KPIs can be identified immediately. In addition, by conducting causal analysis based on the KPI tree for the management goals, problems can be addressed swiftly when KPIs are not being achieved. This helps you to reach your KPIs.
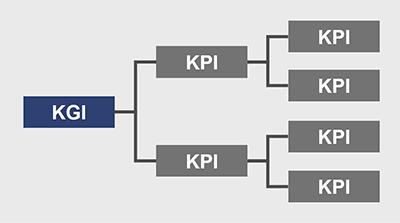
A KPI tree represents KPIs in a tree format that is configured to achieve the KGI (Key Goal Indicator), which is the goal of an organization or company. The KPI tree visualizes the thoughts and actions to achieve the goal and the relationship between each KPI. When a problem occurs, organizing it using a KPI tree makes it easier to identify the underlying factors.
For details on the solution, see the following:
Real-time information from manufacturing sites can be used to optimize the entire manufacturing site. In addition to enabling automation of manufacturing processes, the information can be used for procurement of materials and parts, quality control, and product shipment. The information supports quick decision-making based on KPIs in a variety of fields including food and chemistry.
