Working for the global environment
Hitachi defines itself by the contribution we make in tackling society’s challenges. We promote environmental management with a future perspective, contributing through our business activities to solving critical global environmental issues.

Our Priorities
We have established an environmental vision and long-term environmental targets, “Hitachi Environmental Innovation 2050”, to promote environmental activities throughout the entire Group.
Environmental Vision
With the three strategic pillars of “Decarbonization”, “Circular Economy”, and “Nature Positive” as our environmental vision, Hitachi aims to become a global leader in green transformation (“GX”) through its Social Innovation Business to help protect our Planet and achieve well-being for People.
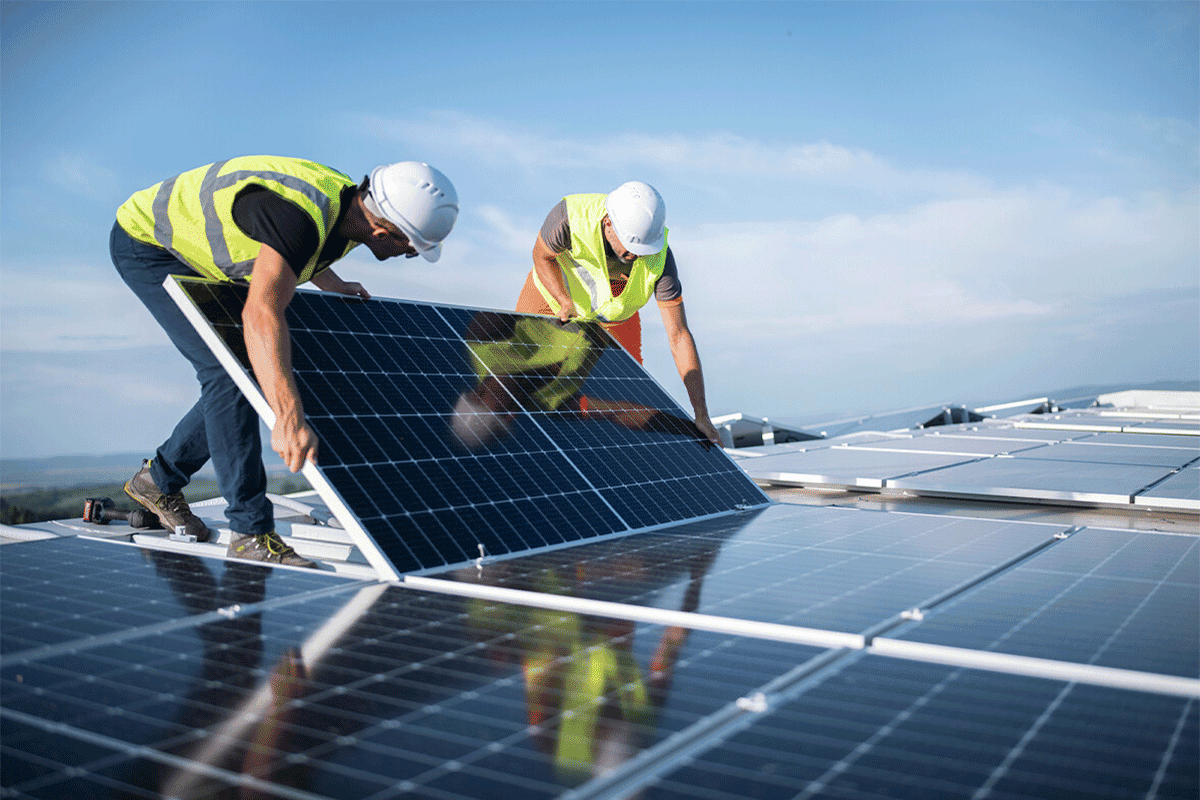
- Decarbonization
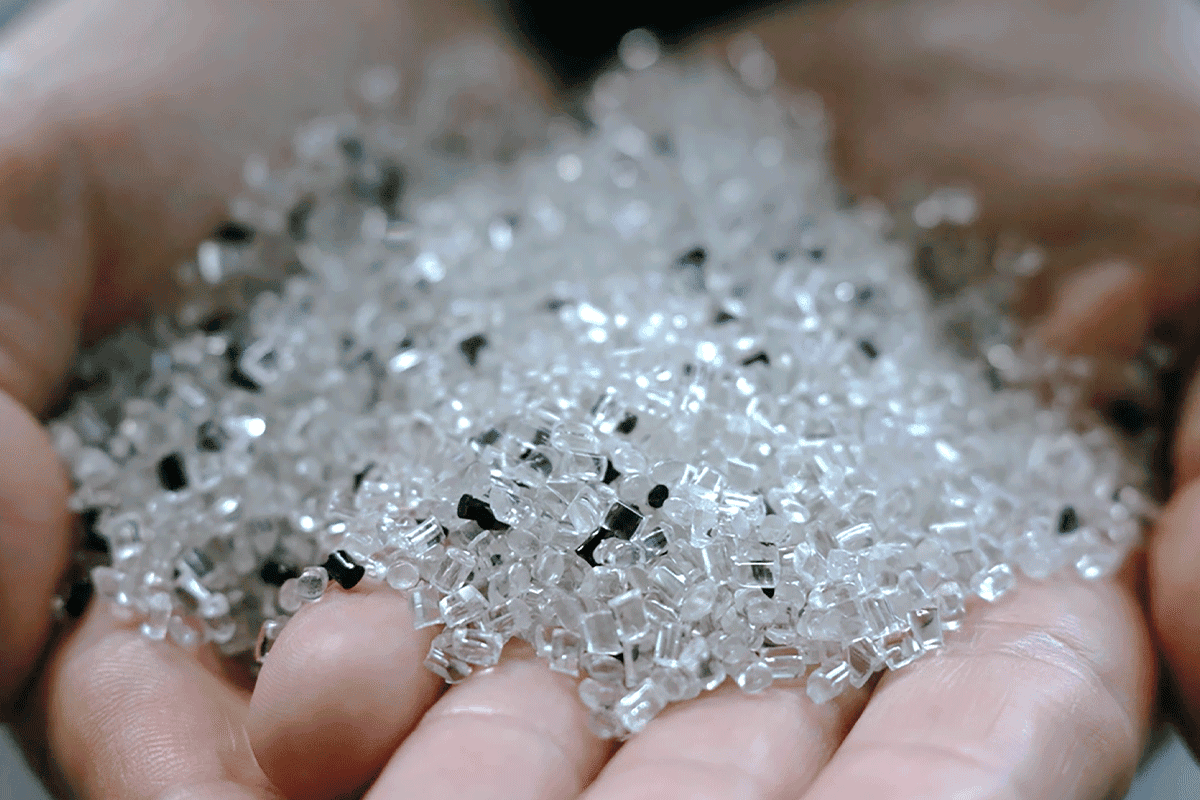
- Circular Economy
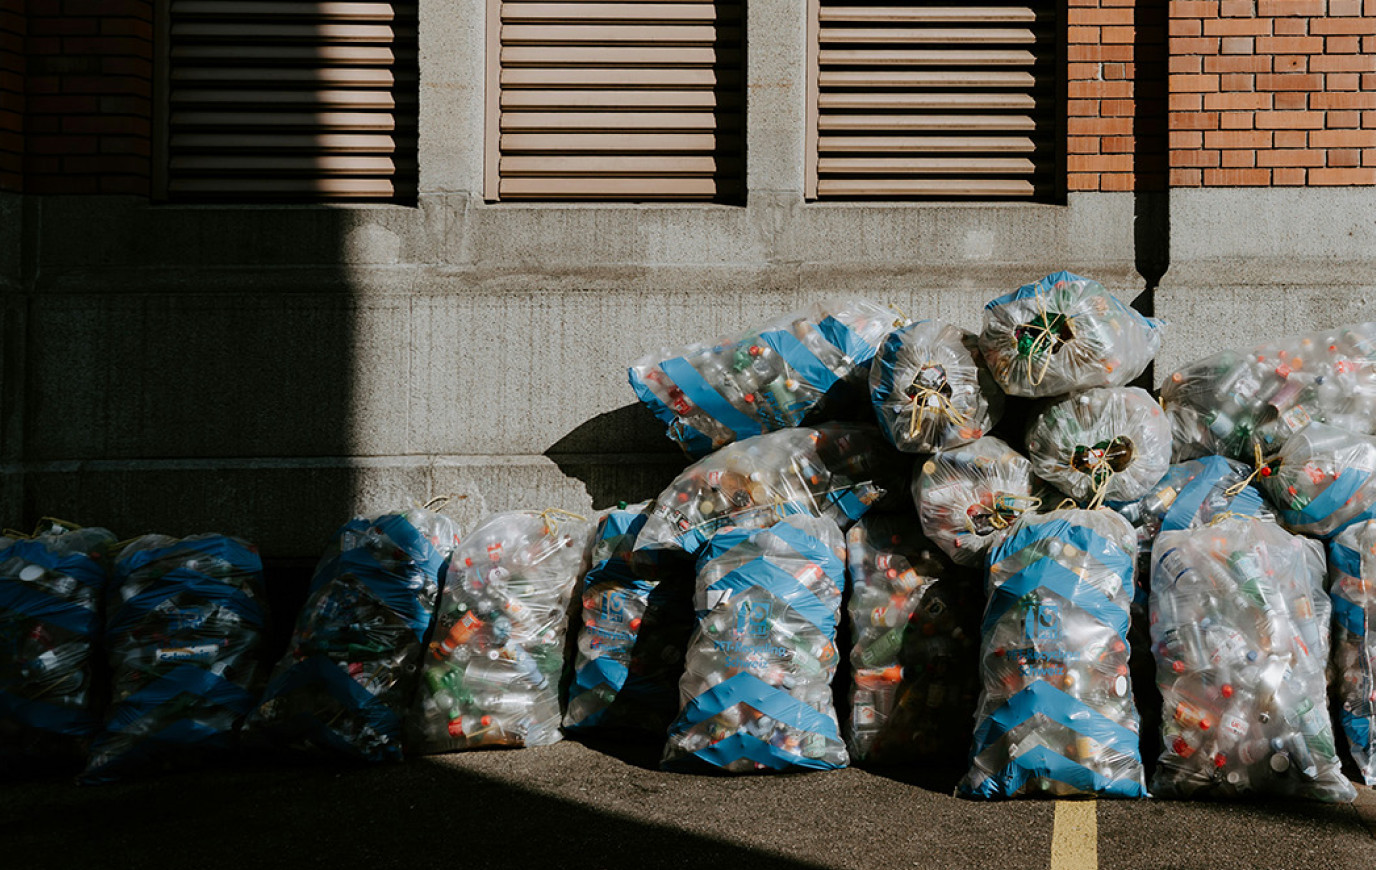
- Nature Positive
Net Zero
by FY2050
Decarbonize the value chain by highly efficient products, innovative services, and future technologies
Circular Transformation
by FY2050
Maximize the value throughout the entire lifecycle of products and services by building evolving business ecosystems

Nature Resilience
by FY2050
As a responsible partner for infrastructure, minimize the impact on and from nature, ensuring swift recovery
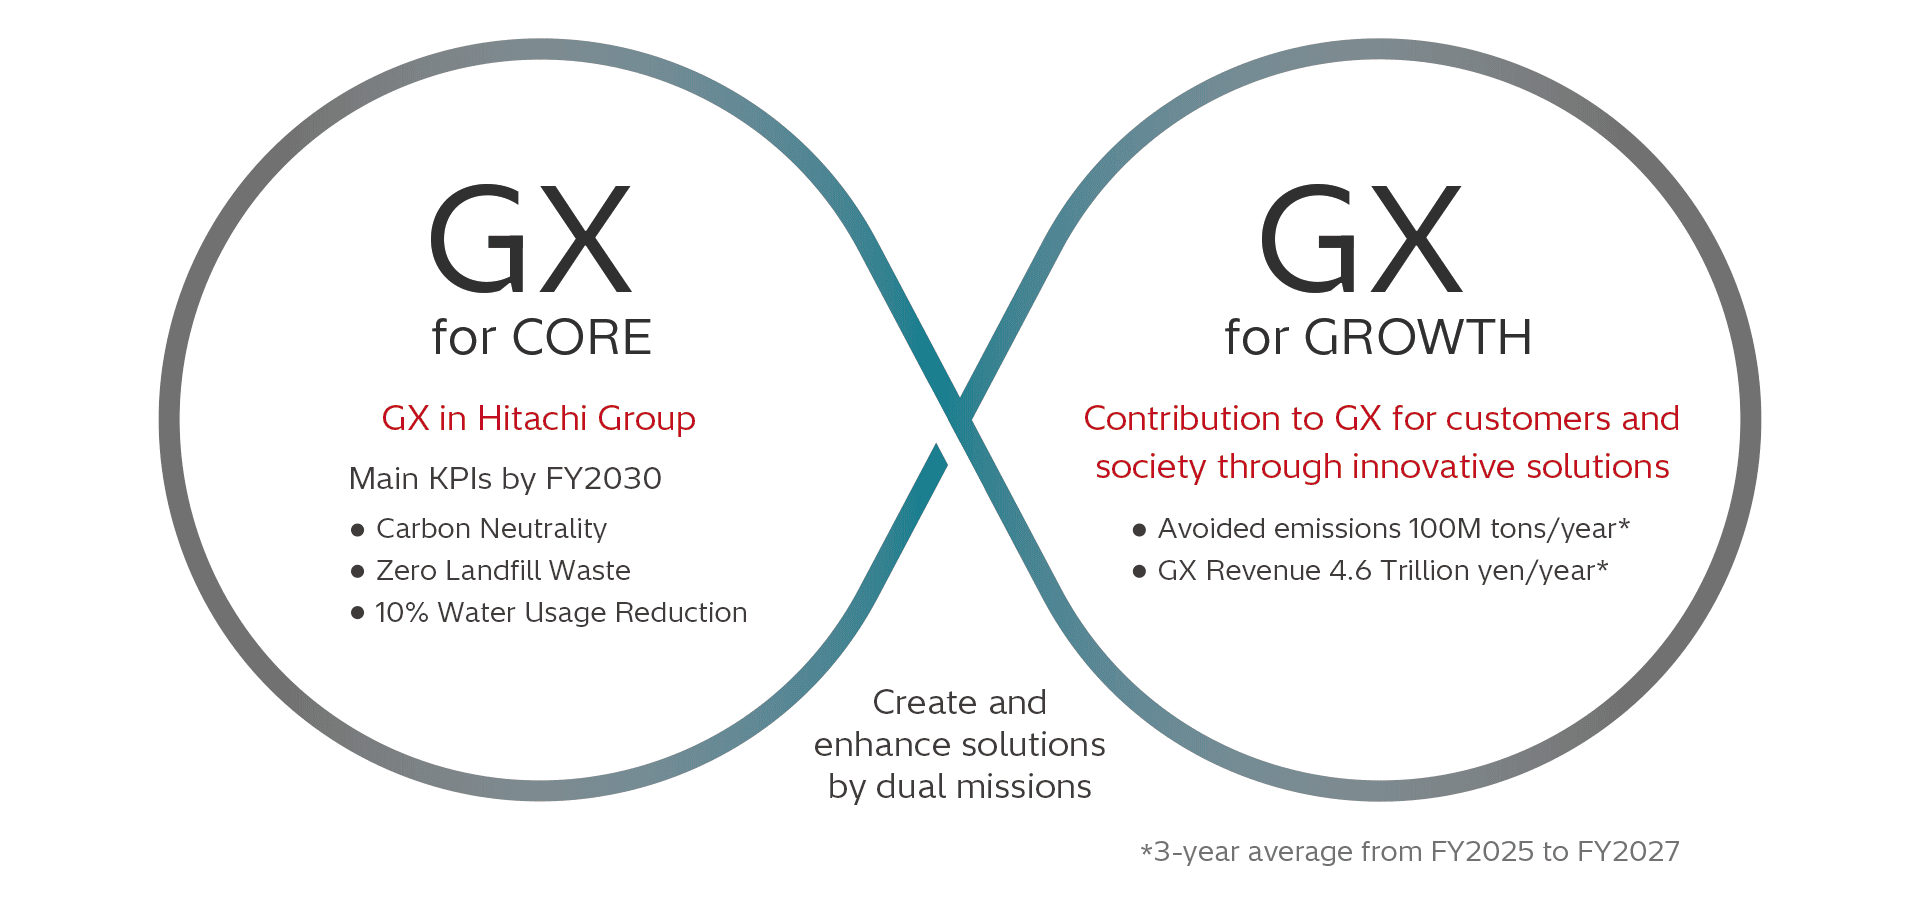
Pursue dual missions of “GX for CORE” and “GX for GROWTH” to achieve our environmental targets using data and innovative technology.
Performance in FY2024


Net Zero
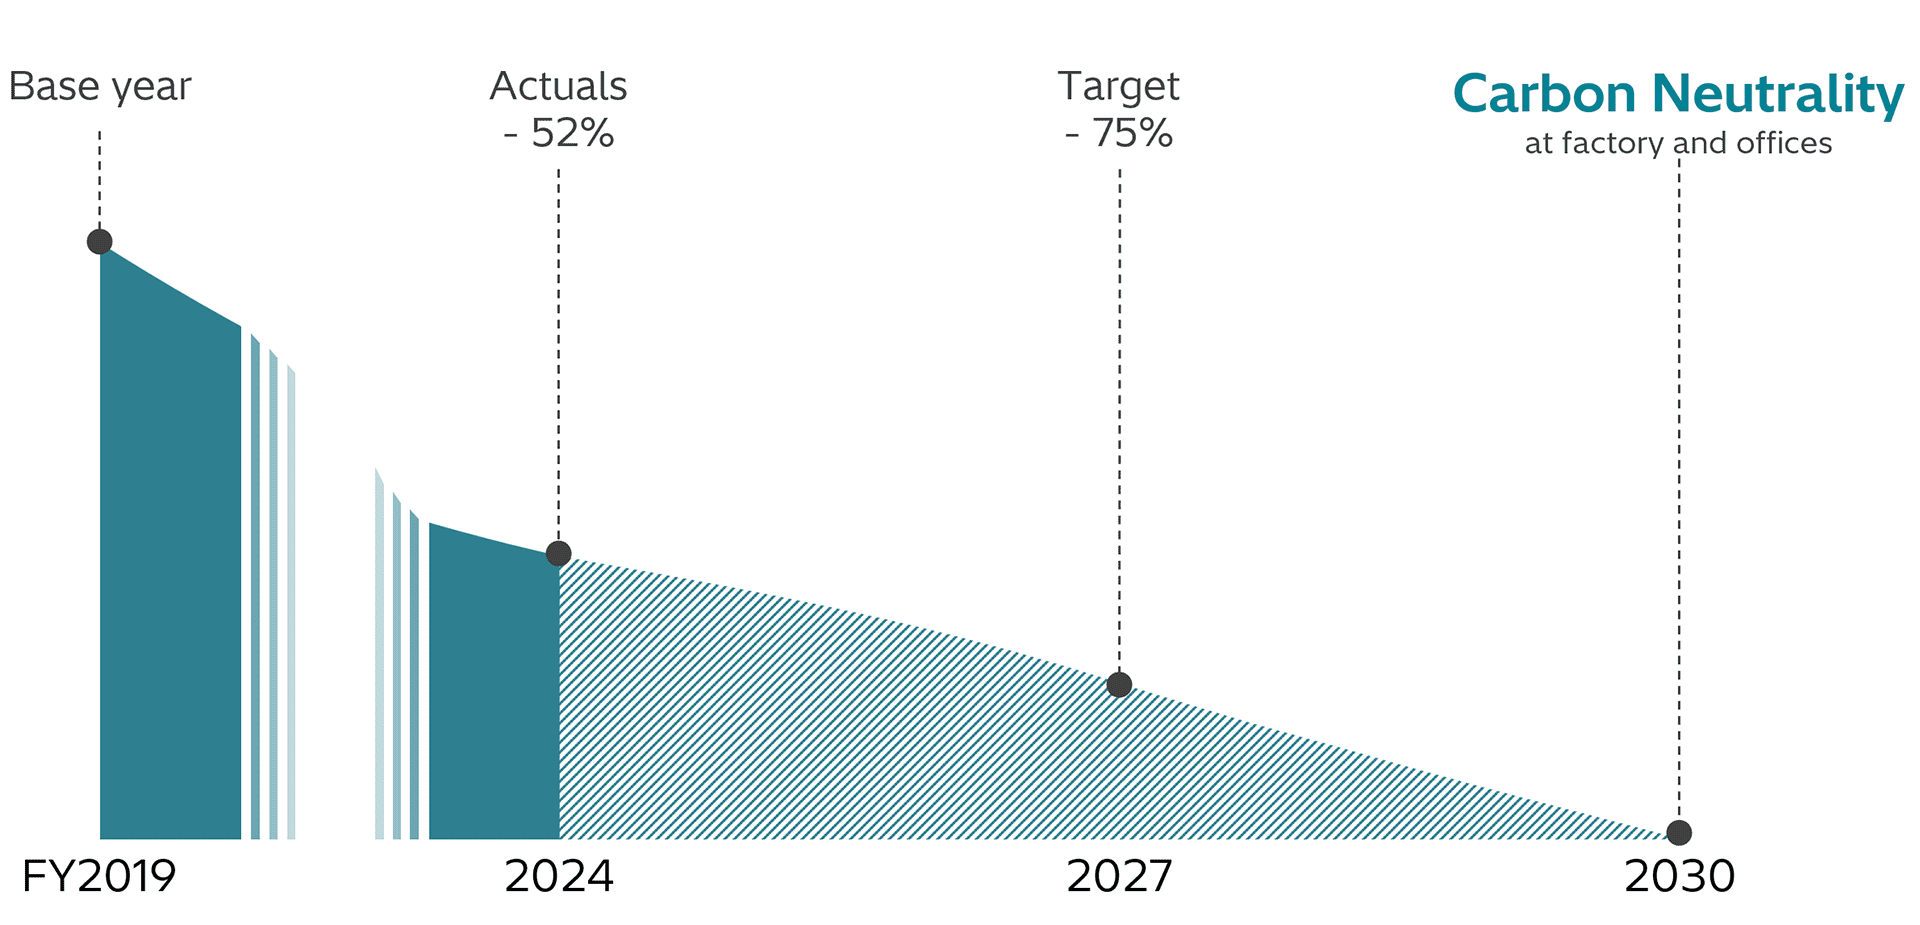
Hitachi will accelerate measures to reduce its own GHG emissions to achieve carbon neutrality at business sites (factories and offices) by FY2030 and Net Zero across the entire value chain by fiscal 2050.
Approach for GHG emissions reduction in factories and offices
- Energy saving, renewable energy system installation, and leverage of PPA
- Procurement of non-fossil energy (purchases and certificates)
etc.
In addition to these efforts, Hitachi will also contribute to the decarbonization of society offering products and services with minimal environmental impact and by promoting solutions that reduce GHG emissions for its customers and the broader community.
Circular Transformation
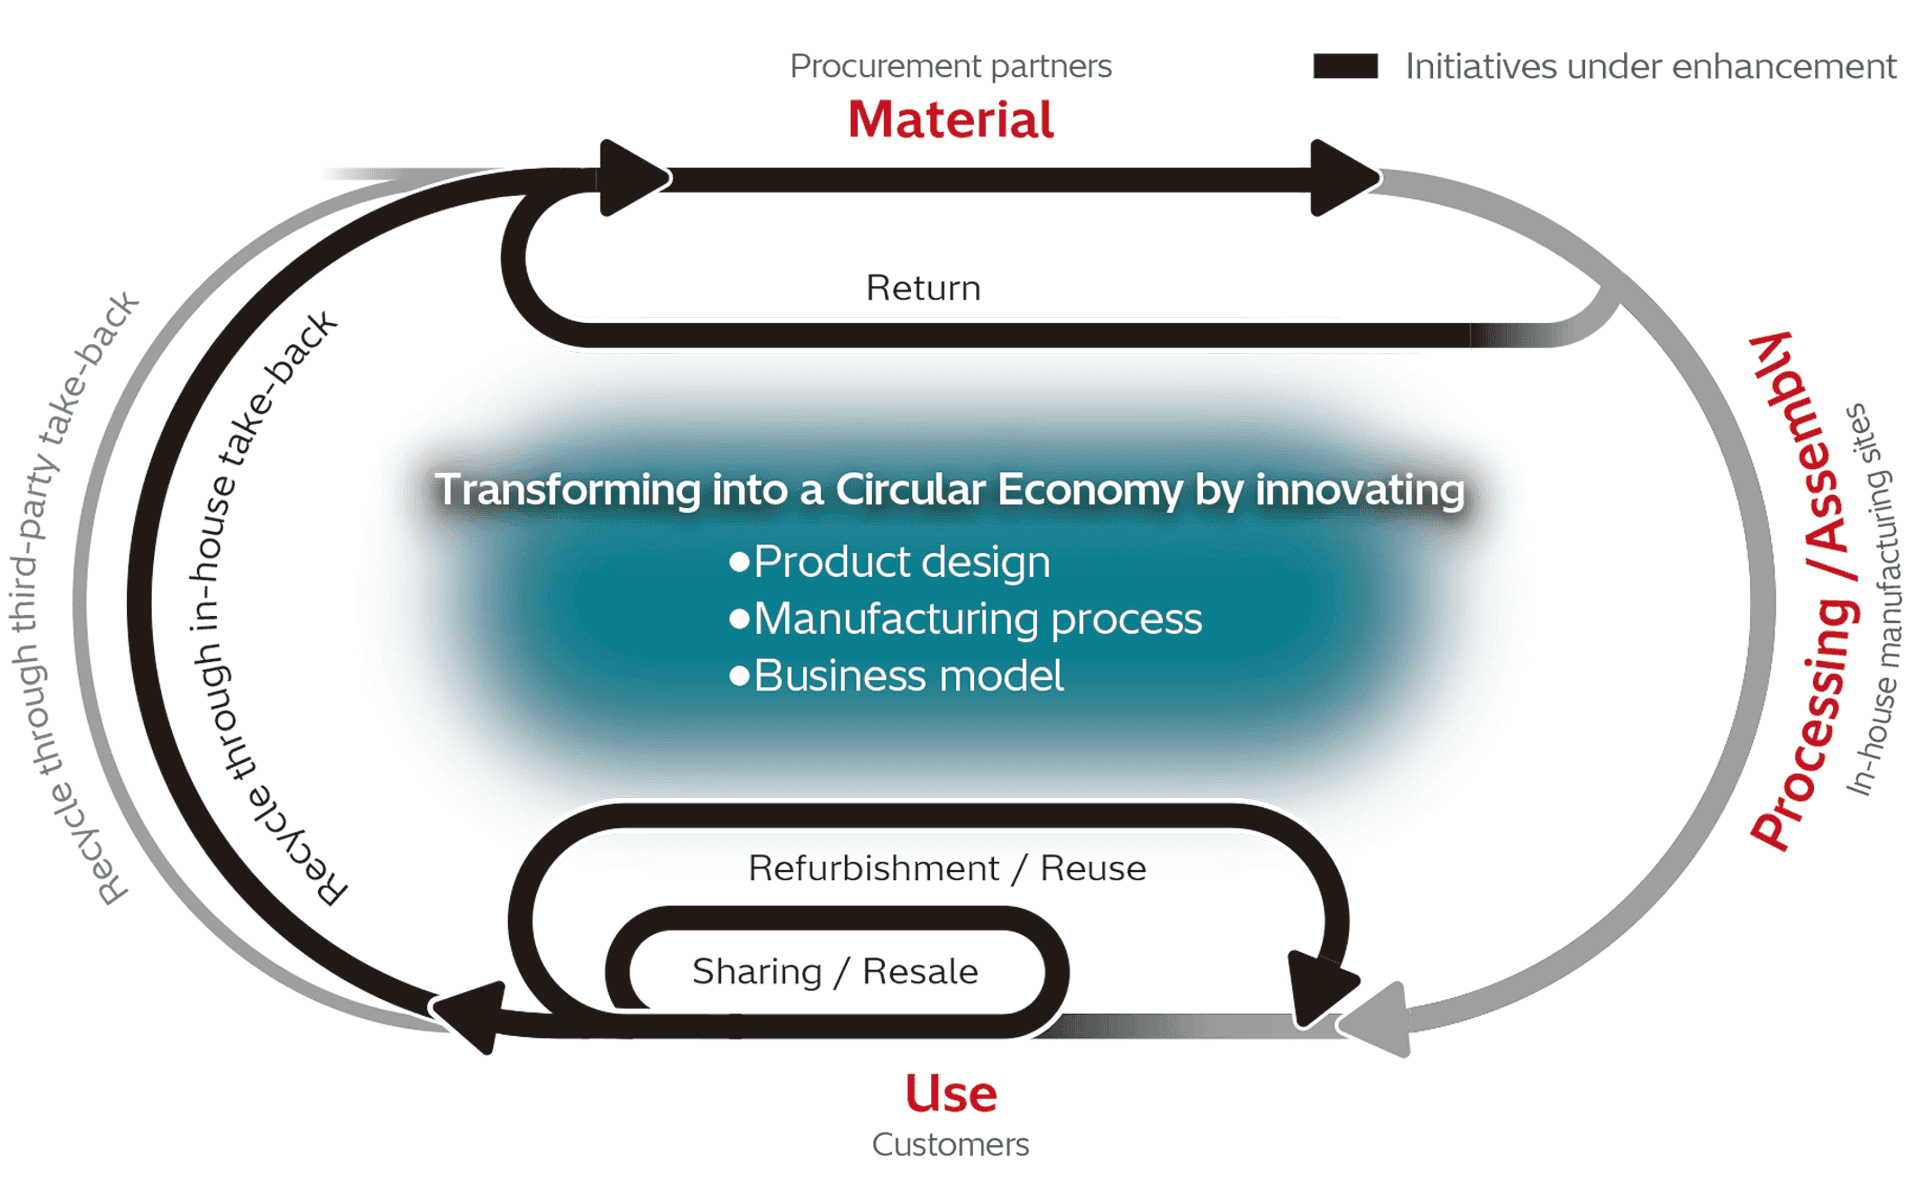
Hitachi aims to achieve a circular transformation of resources and business by FY2050. Circular transformation involves shifting toward circular business models by minimizing energy and resource use and maximizing value throughout the entire lifecycle of products and services through initiatives such as enhancing value and extending product lifespans during product usage via sharing and recurring use, and recovering resources from end-of life products through remanufacturing or recycling.
Innovating our product design
Through environmentally conscious design assessments and life cycle assessments for new products that involve design activities, we will reduce waste by standardizing parts, extending service life, utilizing recycled materials, and designing for easy recyclability, while considering resource circulation across the whole supply chain.
Innovating our manufacturing process
We are promoting initiatives by sharing case studies across divisions. These initiatives include optimizing production volume based on supply and demand analysis, implementing paperless design, reducing packaging materials and defective products through quality improvements.. Furthermore, we aim for zero landfill waste at our manufacturing sites.
Innovating our business models
In response to societal shifts from things to experiences and from ownership to usage, we promote the effective utilization of resources and assets through leasing, pay-per-use models, subscriptions, products as a service (PaaS), reuse, and sharing.
Additionally, we collect used products and explore their reuse through resale, repair parts, and recycling, striving to maximize resource utilization.
Nature Resilience
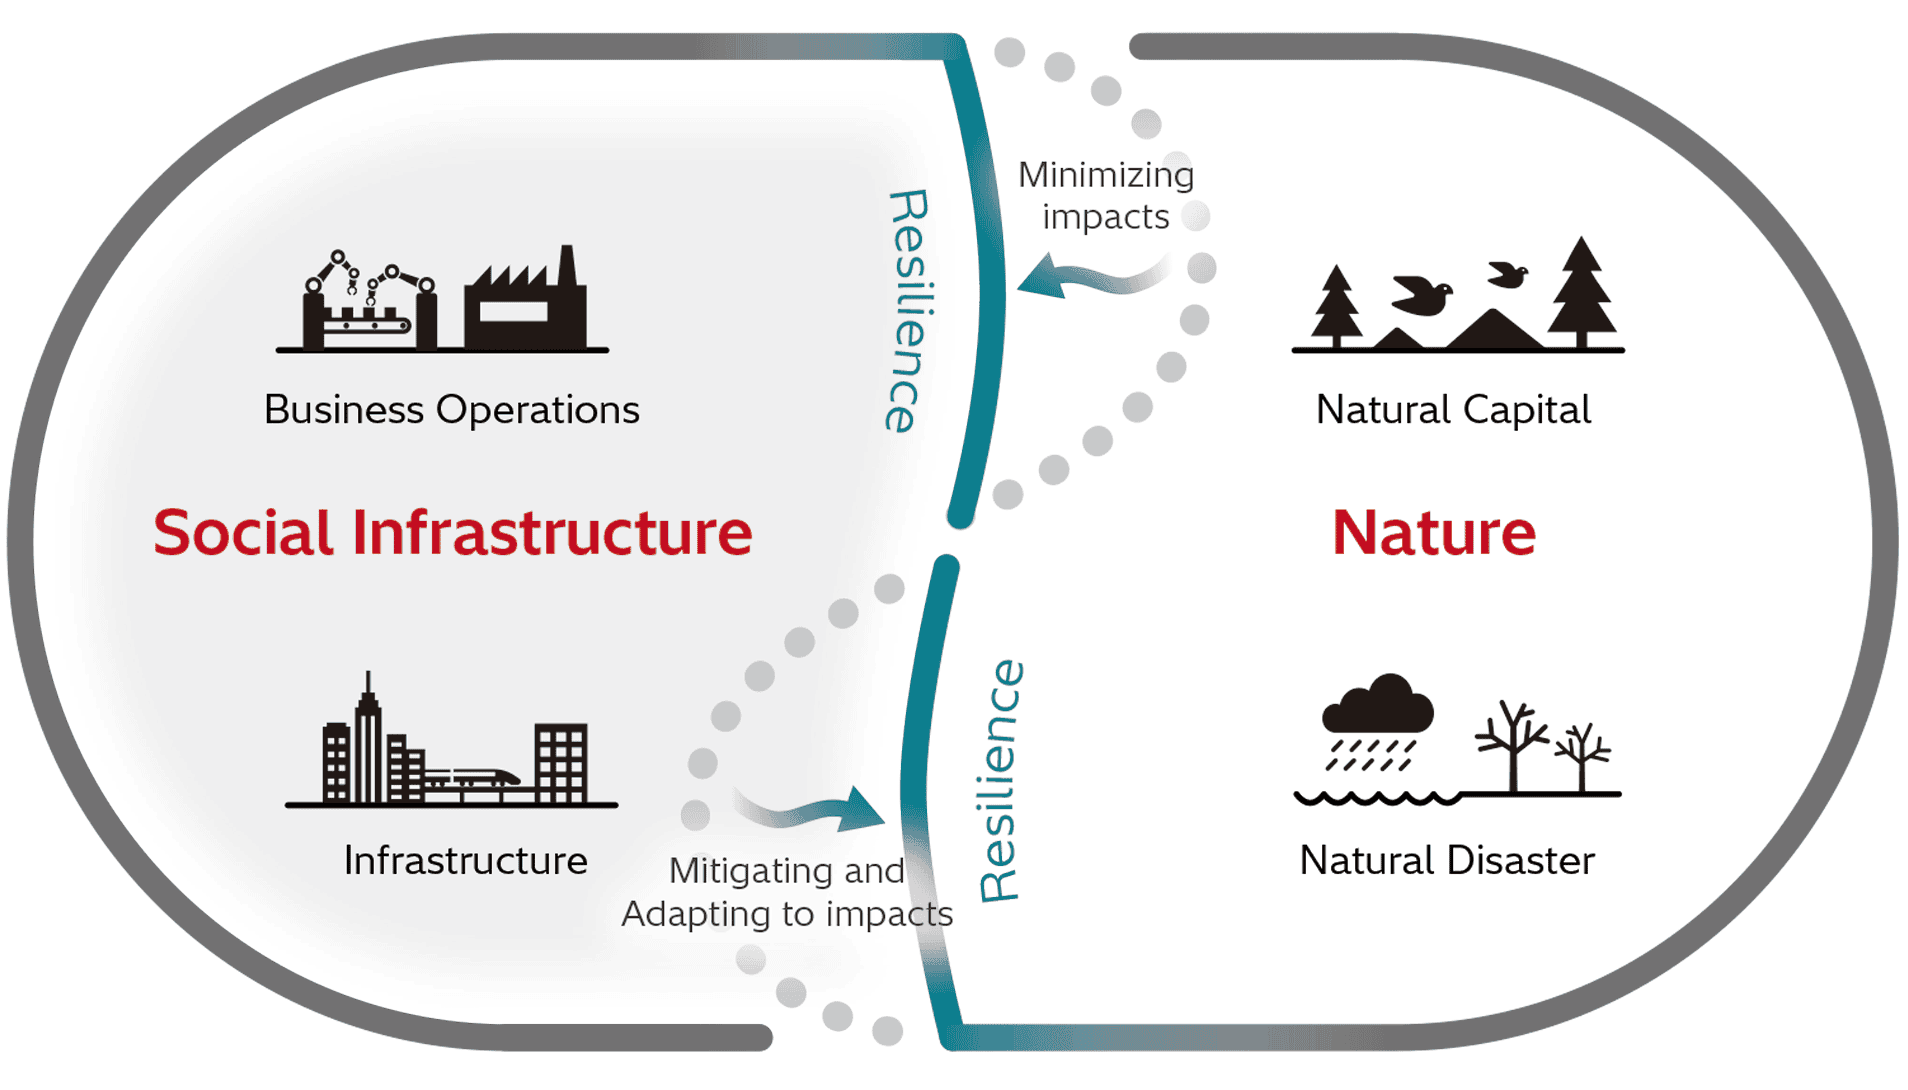
Hitachi aims to achieve a nature resilience by 2050, which not only focuses on minimizing impacts on natural capital but also addresses mitigating damage from natural disasters and supporting faster recovery.
Waterusage reduction
We recognize water as a vital natural resource and are committed to reducing water usage in manufacturing processes and domestic water consumption at our production facilities. We promote efficient water utilization through enhanced water intake management, leak prevention measures, cooling water recycling, and wastewater purification.
Impactassessment on and from nature
While closely monitoring international initiatives, regulatory trends, such as the Conference of the Parties to Convention on Biological Diversity (CBD-COP), as well as the Taskforce on Nature-related Financial Disclosures (TNFD).We conduct impact assessments that evaluate the mutual interactions with nature across the entire value chain for major products and projects.


